Proctor and Gamble 2016 Annual Report Download - page 75
Download and view the complete annual report
Please find page 75 of the 2016 Proctor and Gamble annual report below. You can navigate through the pages in the report by either clicking on the pages listed below, or by using the keyword search tool below to find specific information within the annual report.-
 1
1 -
2
-
3
-
4
-
5
-
6
-
7
-
8
-
9
-
10
-
11
-
12
-
13
-
14
-
15
-
16
-
17
-
18
-
19
-
20
-
21
-
22
-
23
-
24
-
25
-
26
-
27
-
28
-
29
-
30
-
31
-
32
-
33
-
34
-
35
-
36
-
37
-
38
-
39
-
40
-
41
-
42
-
43
-
44
-
45
-
46
-
47
-
48
-
49
-
50
-
51
-
52
-
53
-
54
-
55
-
56
-
57
-
58
-
59
-
60
-
61
-
62
-
63
-
64
-
 65
65 -
 66
66 -
 67
67 -
 68
68 -
 69
69 -
 70
70 -
 71
71 -
 72
72 -
 73
73 -
 74
74 -
 75
75 -
 76
76 -
 77
77 -
 78
78 -
 79
79 -
 80
80 -
 81
81 -
 82
82 -
 83
83 -
 84
84 -
 85
85 -
86
-
87
-
88
-
89
-
90
-
91
-
92
 |
 |

The Procter & Gamble Company 61
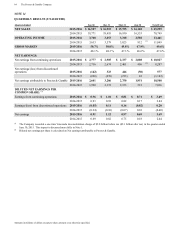
Amounts in millions of dollars except per share amounts or as otherwise specified.
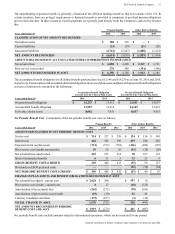
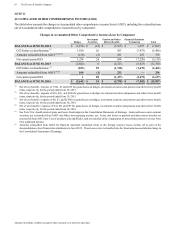
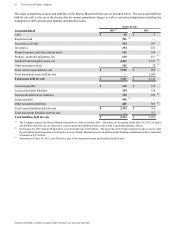
The following table summarizes total assets and liabilities held for sale and reconciles to the Consolidated Balance Sheets:
Years ended June 30 2016 2015
Beauty Brands Beauty Brands Batteries Total
Current assets held for sale $ 7,185 $ 922 $ 3,510 $ 4,432
Noncurrent assets held for sale —5,204 — 5,204
Total assets held for sale $ 7,185 $ 6,126 $ 3,510 $ 9,636
Current liabilities held for sale $ 2,343 $ 356 $ 1,187 $ 1,543
Noncurrent liabilities held for sale —717 — 717
Total liabilities held for sale $ 2,343 $ 1,073 $ 1,187 $ 2,260
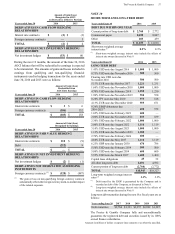
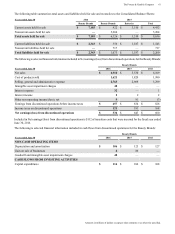
The following is selected financial information included in Net earnings/(loss) from discontinued operations for the Beauty Brands:
Beauty Brands
Years ended June 30 2016 2015 2014
Net sales $ 4,910 $ 5,530 $ 6,109
Cost of products sold 1,621 1,820 1,980
Selling, general and administrative expense 2,763 2,969 3,299
Intangible asset impairment charges 48 ——
Interest expense 32 —1
Interest income 222
Other non-operating income/(loss), net 991 (3)
Earnings from discontinued operations before income taxes $ 457 $ 834 $ 828
Income taxes on discontinued operations 121 191 168
Net earnings/(loss) from discontinued operations $ 336 $ 643 $ 660
Included in Net earnings/(loss) from discontinued operations is $112 of transition costs that were incurred for the fiscal year ended
June 30, 2016.
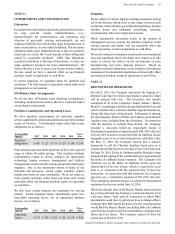
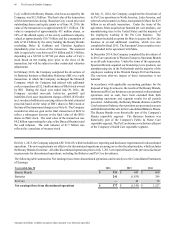
The following is selected financial information included in cash flows from discontinued operations for the Beauty Brands:
Beauty Brands
Years ended June 30 2016 2015 2014
NON-CASH OPERATING ITEMS
Depreciation and amortization $ 106 $ 125 $ 127
Gain on sale of businesses 886 —
Goodwill and intangible asset impairment charges 48 ——
CASH FLOWS FROM INVESTING ACTIVITIES
Capital expenditures $ 114 $ 106 $ 108