Proctor and Gamble 2016 Annual Report Download - page 37
Download and view the complete annual report
Please find page 37 of the 2016 Proctor and Gamble annual report below. You can navigate through the pages in the report by either clicking on the pages listed below, or by using the keyword search tool below to find specific information within the annual report.-
 1
1 -
2
-
3
-
4
-
5
-
6
-
7
-
8
-
9
-
10
-
11
-
12
-
13
-
14
-
15
-
16
-
17
-
18
-
19
-
20
-
21
-
22
-
23
-
24
-
25
-
26
-
 27
27 -
 28
28 -
 29
29 -
 30
30 -
 31
31 -
 32
32 -
 33
33 -
 34
34 -
 35
35 -
 36
36 -
 37
37 -
 38
38 -
 39
39 -
 40
40 -
 41
41 -
 42
42 -
 43
43 -
 44
44 -
 45
45 -
 46
46 -
 47
47 -
48
-
49
-
50
-
51
-
52
-
53
-
54
-
55
-
56
-
57
-
58
-
59
-
60
-
61
-
62
-
63
-
64
-
65
-
66
-
67
-
68
-
69
-
70
-
71
-
72
-
73
-
74
-
75
-
76
-
77
-
78
-
79
-
80
-
81
-
82
-
83
-
84
-
85
-
86
-
87
-
88
-
89
-
90
-
91
-
92
 |
 |

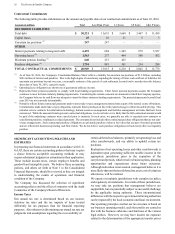
The Procter & Gamble Company 23
Net earnings were unchanged at $2.9 billion as the reduction
in net sales was offset by a 50 basis-point increase in net
earnings margin. Net earnings margin increased due to higher
gross margin, partially offset by an increase in SG&A as a
percent of net sales. The increase in gross margin was driven
by higher pricing and manufacturing cost savings, partially
offset by foreign exchange. SG&A as a percent of net sales
increased as spending reductions did not keep pace with the
currency-driven decline in sales.
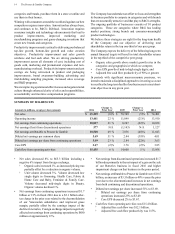
CORPORATE
($ millions) 2016
Change
vs. 2015 2015
Change
vs. 2014
Net sales $422 (9)% $466 (37)%
Net loss $(174) N/A $(2,420) N/A
Corporate includes certain operating and non-operating
activities not allocated to specific business segments. These
include: the incidental businesses managed at the corporate
level; financing and investing activities; other general
corporate items; the gains and losses related to certain divested
brands and categories; certain restructuring-type activities to
maintain a competitive cost structure, including manufacturing
and workforce optimization; certain significant asset
impairment and deconsolidation charges; and certain balance
sheet impacts from significant foreign exchange devaluations.
Corporate also includes reconciling items to adjust the
accounting policies used in the segments to U.S. GAAP. The
most significant reconciling item includes income taxes to
adjust from blended statutory rates that are reflected in the
segments to the overall Company effective tax rate.
Fiscal year 2016 compared with fiscal year 2015
Corporate net sales decreased $44 million during the fiscal
year. Corporate net earnings from continuing operations
improved by approximately $2.2 billion during the fiscal year,
primarily due to the $2.1 billion Venezuela deconsolidation
charge in the prior fiscal year and lower foreign currency
transactional charges. Additional discussion of these items
impacting net earnings in Corporate are included in the Results
of Operations section.
Fiscal year 2015 compared with fiscal year 2014
Net sales in Corporate decreased by $271 million in 2015
primarily due to the prior year divestiture of the MDVIP
business. Corporate net expenses from continuing operations
increased $2.0 billion in 2015, primarily due to the charge
related to the deconsolidation of the Venezuelan subsidiaries,
increased foreign exchange transactional charges and
incremental restructuring charges, which were partially offset
by gains on minor brand divestitures.
Productivity and Cost Savings Plan
In 2012, the Company initiated a productivity and cost savings
plan to reduce costs and better leverage scale in the areas of
supply chain, research and development, marketing and
overheads. The plan was designed to accelerate cost reductions
by streamlining management decision making, manufacturing
and other work processes to fund the Company's growth
strategy.
As part of this plan, the Company expects to incur
approximately $5.5 billion in before-tax restructuring costs
over a six-year period (from fiscal 2012 through fiscal 2017).
Through the end of fiscal 2016, 89% of the expected costs have
been incurred. Savings generated from the restructuring costs
are difficult to estimate, given the nature of the activities, the
timing of the execution and the degree of reinvestment.
Overall, these costs and other non-manufacturing enrollment
reductions are expected to deliver approximately $3.0 billion
in annual before-tax gross savings. The cumulative before-tax
savings realized through 2016 were approximately $2.4
billion.
Restructuring accruals of $315 million as of June 30, 2016 are
classified as current liabilities. During fiscal 2016, 51% of the
restructuring charges incurred either have been or will be
settled with cash. Consistent with our historical policies for
ongoing restructuring-type activities, the resulting charges are
funded by and included within Corporate for segment
reporting.
In addition to our restructuring programs, we have additional
ongoing savings efforts in our supply chain, marketing and
overhead areas that yield additional benefits to our operating
margins.
Refer to Note 3 to our Consolidated Financial Statements for
more details on the restructuring program and to the Operating
Costs section of the MD&A for more information about the
total benefit to operating margins from our total savings efforts.
CASH FLOW, FINANCIAL CONDITION AND
LIQUIDITY
We believe our financial condition continues to be of high
quality, as evidenced by our ability to generate substantial cash
from operations and to readily access capital markets at
competitive rates.
Operating cash flow provides the primary source of cash to
fund operating needs and capital expenditures. Excess
operating cash is used first to fund shareholder dividends.
Other discretionary uses include share repurchases and
acquisitions to complement our portfolio of businesses, brands
and geographies. As necessary, we may supplement operating
cash flow with debt to fund these activities. The overall cash
position of the Company reflects our strong business results
and a global cash management strategy that takes into account
liquidity management, economic factors and tax
considerations.
Operating Cash Flow
Fiscal year 2016 compared with fiscal year 2015
Operating cash flow was $15.4 billion in 2016, a 6% increase
from the prior year. Net earnings, adjusted for non-cash items
(depreciation and amortization, share-based compensation,
deferred income taxes, loss/(gain) on sale of businesses and
impairment charges) generated $13.6 billion of operating cash