Proctor and Gamble 2016 Annual Report Download - page 3
Download and view the complete annual report
Please find page 3 of the 2016 Proctor and Gamble annual report below. You can navigate through the pages in the report by either clicking on the pages listed below, or by using the keyword search tool below to find specific information within the annual report.-
 1
1 -
 2
2 -
 3
3 -
 4
4 -
 5
5 -
 6
6 -
 7
7 -
 8
8 -
 9
9 -
 10
10 -
 11
11 -
 12
12 -
 13
13 -
 14
14 -
15
-
16
-
17
-
18
-
19
-
20
-
21
-
22
-
23
-
24
-
25
-
26
-
27
-
28
-
29
-
30
-
31
-
32
-
33
-
34
-
35
-
36
-
37
-
38
-
39
-
40
-
41
-
42
-
43
-
44
-
45
-
46
-
47
-
48
-
49
-
50
-
51
-
52
-
53
-
54
-
55
-
56
-
57
-
58
-
59
-
60
-
61
-
62
-
63
-
64
-
65
-
66
-
67
-
68
-
69
-
70
-
71
-
72
-
73
-
74
-
75
-
76
-
77
-
78
-
79
-
80
-
81
-
82
-
83
-
84
-
85
-
86
-
87
-
88
-
89
-
90
-
91
-
92
 |
 |

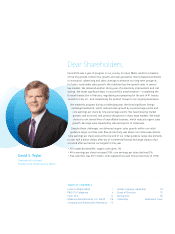
Dear Shareholders,
Fiscal 2016 was a year of progress in our journey to return P&G’s results to a balance
of top-line growth, bottom-line growth and cash generation. We increased investments
in innovation, advertising and sales coverage to enhance our long-term prospects
for faster, sustainable sales growth. We stabilized top-line growth rates in several
key markets. We delivered another strong year of productivity improvement and cost
savings. We made significant steps in our portfolio transformation — completing the
Duracell transaction in February, negotiating and preparing for the sale of 41 beauty
brands to Coty Inc., and streamlining the product lineups in our ongoing businesses.
We made this progress during a challenging year. We faced significant foreign
exchange headwinds, which reduced sales growth by six percentage points and
core earnings per share by nine percentage points. We faced slowing market
growth, and economic and political disruptions in many large markets. We made
choices to exit several lines of unprofitable business, which reduced organic sales
growth. Earnings were impacted by reduced exports to Venezuela.
Despite these challenges, we delivered organic sales growth within our initial
guidance range, and free cash flow productivity was above our initial expectations.
Core earnings per share were at the low end of our initial guidance range due primarily
to over half a billion dollars after-tax of incremental foreign exchange impacts that
occurred after we had set our targets for the year.
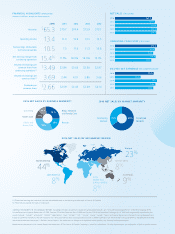
• All-in sales declined 8%; organic sales grew 1%
• All-in earnings per share increased 51%; core earnings per share declined 2%
• Free cash flow was $12.1 billion, with adjusted free cash flow productivity of 115%
David S. Taylor
Chairman of the Board,
President and Chief Executive Officer
TABLE OF CONTENTS
Letter to Shareholders i
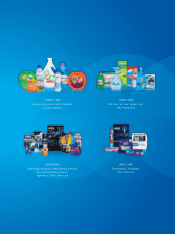
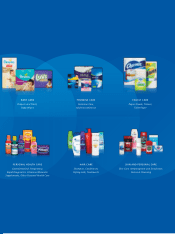
P&G’s 10 Categories ii
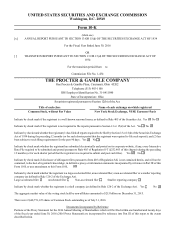
Form 10-K ix
Measures Not Defined by U.S. GAAP 29
Company and Shareholder Information 73
Global Company Leadership 74
Board of Directors 75
Recognition 76
Citizenship Inside Back Cover