Proctor and Gamble 2016 Annual Report Download - page 62
Download and view the complete annual report
Please find page 62 of the 2016 Proctor and Gamble annual report below. You can navigate through the pages in the report by either clicking on the pages listed below, or by using the keyword search tool below to find specific information within the annual report.-
 1
1 -
2
-
3
-
4
-
5
-
6
-
7
-
8
-
9
-
10
-
11
-
12
-
13
-
14
-
15
-
16
-
17
-
18
-
19
-
20
-
21
-
22
-
23
-
24
-
25
-
26
-
27
-
28
-
29
-
30
-
31
-
32
-
33
-
34
-
35
-
36
-
37
-
38
-
39
-
40
-
41
-
42
-
43
-
44
-
45
-
46
-
47
-
48
-
49
-
50
-
51
-
 52
52 -
 53
53 -
 54
54 -
 55
55 -
 56
56 -
 57
57 -
 58
58 -
 59
59 -
 60
60 -
 61
61 -
 62
62 -
 63
63 -
 64
64 -
 65
65 -
 66
66 -
 67
67 -
 68
68 -
 69
69 -
 70
70 -
 71
71 -
 72
72 -
73
-
74
-
75
-
76
-
77
-
78
-
79
-
80
-
81
-
82
-
83
-
84
-
85
-
86
-
87
-
88
-
89
-
90
-
91
-
92
 |
 |

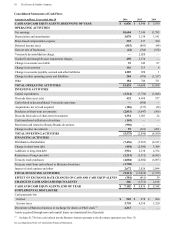
48 The Procter & Gamble Company
Amounts in millions of dollars except per share amounts or as otherwise specified.
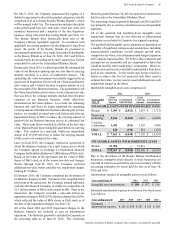
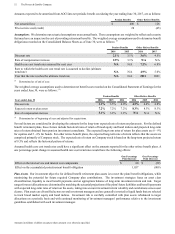
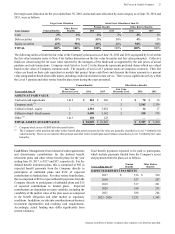
NOTE 6
EARNINGS PER SHARE
Net earnings attributable to Procter & Gamble less preferred dividends (net of related tax benefits) are divided by the weighted
average number of common shares outstanding during the year to calculate Basic net earnings per common share. Diluted net
earnings per common share are calculated to give effect to stock options and other stock-based awards (see Note 7) and assume
conversion of preferred stock (see Note 8).
Net earnings/(loss) attributable to Procter & Gamble and common shares used to calculate Basic and Diluted net earnings per
share were as follows:
Years ended June 30 2016 2015 2014
CONSOLIDATED AMOUNTS
Continuing
Operations
Dis-
continued
Operations
Total
Continuing
Operations
Dis-
continued
Operations
Total
Continuing
Operations
Dis-
continued
Operations
Total
Net earnings/(loss) $10,027 $ 577 $10,604 $8,287$
(1,143) $ 7,144 $10,658 $ 1,127 $ 11,785
Net earnings attributable to
noncontrolling interests (96) — (96)(98)(10)(108)(120)(22)(142)
Net earnings/(loss) attributable
to P&G (Diluted) 9,931 577 10,508 8,189 (1,153) 7,036 10,538 1,105 11,643
Preferred dividends, net of tax (255) — (255)(259)—
(259)(253)—
(253)
Net earnings/(loss) attributable
to P&G available to common
shareholders (Basic) $ 9,676 $ 577 $ 10,253 $7,930$
(1,153) $ 6,777 $10,285 $ 1,105 $ 11,390
SHARES IN MILLIONS
Basic weighted average common
shares outstanding 2,698.9 2,698.9 2,698.9 2,711.7 2,711.7 2,711.7 2,719.8 2,719.8 2,719.8
Add: Effect of dilutive securities
Conversion of preferred shares
(1)
103.9 103.9 103.9 108.6 108.6 108.6 112.3 112.3 112.3
Impact of stock options and
other unvested equity awards
(2)
41.6 41.6 41.6 63.3 63.3 63.3 72.6 72.6 72.6
Diluted weighted average
common shares outstanding 2,844.4 2,844.4 2,844.4 2,883.6 2,883.6 2,883.6 2,904.7 2,904.7 2,904.7
PER SHARE AMOUNTS
Basic net earnings/(loss) per
common share
(3)
$ 3.59 $ 0.21 $ 3.80 $2.92$
(0.42) $ 2.50 $ 3.78 $ 0.41 $ 4.19
Diluted net earnings/(loss) per
common share
(3)
$ 3.49 $ 0.20 $ 3.69 $2.84$
(0.40) $ 2.44 $ 3.63 $ 0.38 $ 4.01
(1)
Despite being included currently in Diluted net earnings per common share, the actual conversion to common stock occurs when the
preferred shares are sold. Shares may only be sold after being allocated to the ESOP participants pursuant to the repayment of the ESOP's
obligations through 2035.
(2)
Outstanding stock options of approximately 55 million in 2016, 8 million in 2015 and 9 million in 2014 were not included in the Diluted
net earnings per share calculation because the options were out of the money or to do so would have been antidilutive (i.e., the total proceeds
upon exercise would have exceeded the market value of the underlying common shares).
(3)
Basic net earnings per common share and Diluted net earnings per common share are calculated on Net earnings/(loss) attributable to Procter
&Gamble.
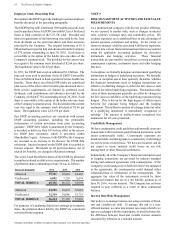
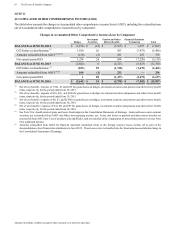
NOTE 7
STOCK-BASED COMPENSATION
We have stock-based compensation plans under which we
annually grant stock option, restricted stock unit (RSU) and
performance stock unit (PSU) awards to key managers and
directors. Exercise prices on options granted have been, and
continue to be, set equal to the market price of the underlying
shares on the date of the grant. Since September 2002, the
grants of key manager stock option awards vest after three years
and have a 10-year life. The key manager stock option awards
granted from July 1998 through August 2002 vested after three
years and have a 15-year life. Key managers can elect to receive
up to the entire value of their option award in RSUs. Key
manager RSUs vest and are settled in shares of common stock
five years from the grant date. The awards provided to the
Company's directors are in the form of RSUs. In addition to
our key manager and director grants, we make other minor
stock option and RSU grants to employees for which the terms
are not substantially different than key manager awards.