Target 2015 Annual Report Download - page 2
Download and view the complete annual report
Please find page 2 of the 2015 Target annual report below. You can navigate through the pages in the report by either clicking on the pages listed below, or by using the keyword search tool below to find specific information within the annual report.-
 1
1 -
 2
2 -
 3
3 -
 4
4 -
 5
5 -
 6
6 -
 7
7 -
 8
8 -
 9
9 -
 10
10 -
 11
11 -
 12
12 -
 13
13 -
14
-
15
-
16
-
17
-
18
-
19
-
20
-
21
-
22
-
23
-
24
-
25
-
26
-
27
-
28
-
29
-
30
-
31
-
32
-
33
-
34
-
35
-
36
-
37
-
38
-
39
-
40
-
41
-
42
-
43
-
44
-
45
-
46
-
47
-
48
-
49
-
50
-
51
-
52
-
53
-
54
-
55
-
56
-
57
-
58
-
59
-
60
-
61
-
62
-
63
-
64
-
65
-
66
-
67
-
68
-
69
-
70
-
71
-
72
-
73
-
74
-
75
-
76
-
77
-
78
-
79
-
80
-
81
-
82
-
83
-
84
 |
 |
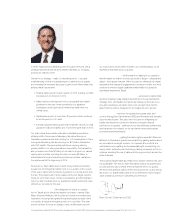
Welcome to our 2015 Annual Report
To explore key stories of the past year
and find out more about what’s in store,
visit target.com/abullseyeview. You can
also view our Annual Report online at
target.com/annualreport.
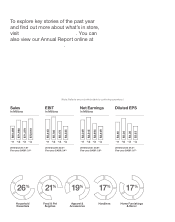
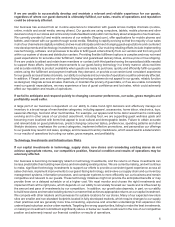
Financial Highlights (Note: Reflects amounts attributable to continuing operations.)
2015 Growth: 1.6%
Five-year CAGR: 3.1%
Sales
In Millions
2015 Growth: 22.0%
Five-year CAGR: 3.4%
EBIT
In Millions
2015 Growth: 35.6%
Five-year CAGR: 5.9%
Net Earnings
In Millions
2015 Growth: 37.2%
Five-year CAGR: 9.7%
Diluted EPS
‘11
$68,466
$71,960
$71,279
$72,618
$73,785
‘12 ‘13 ‘14 ‘15 ‘11
$5,443
$5,740
$5,170
$4,535
$5,530
‘12 ‘13 ‘14 ‘15 ‘11
$3,049
$3,315
$2,694
$2,449
$3,321
‘12 ‘13 ‘14 ‘15 ‘11
$4.46
$5.00
$4.20
$3.83
$5.25
‘12 ‘13 ‘14 ‘15
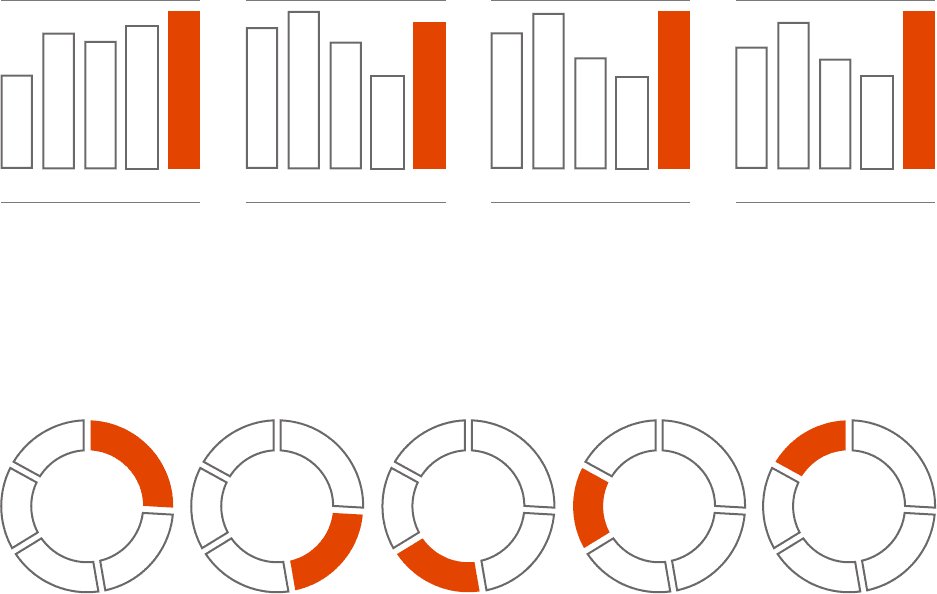
Total Segment Sales: $73.8 Billion
Household
Essentials
26%
Food & Pet
Supplies
21
%
Apparel &
Accessories
19%
Hardlines
17%
Home Furnishings
& Décor
17%