Target 2015 Annual Report Download - page 21
Download and view the complete annual report
Please find page 21 of the 2015 Target annual report below. You can navigate through the pages in the report by either clicking on the pages listed below, or by using the keyword search tool below to find specific information within the annual report.-
 1
1 -
2
-
3
-
4
-
5
-
6
-
7
-
8
-
9
-
10
-
 11
11 -
 12
12 -
 13
13 -
 14
14 -
 15
15 -
 16
16 -
 17
17 -
 18
18 -
 19
19 -
 20
20 -
 21
21 -
 22
22 -
 23
23 -
 24
24 -
 25
25 -
 26
26 -
 27
27 -
 28
28 -
 29
29 -
 30
30 -
 31
31 -
32
-
33
-
34
-
35
-
36
-
37
-
38
-
39
-
40
-
41
-
42
-
43
-
44
-
45
-
46
-
47
-
48
-
49
-
50
-
51
-
52
-
53
-
54
-
55
-
56
-
57
-
58
-
59
-
60
-
61
-
62
-
63
-
64
-
65
-
66
-
67
-
68
-
69
-
70
-
71
-
72
-
73
-
74
-
75
-
76
-
77
-
78
-
79
-
80
-
81
-
82
-
83
-
84
 |
 |

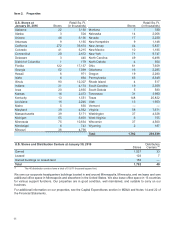
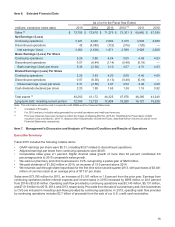
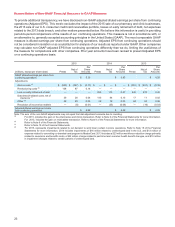
Item€6.€€€€Selected Financial Data
As of or for the Fiscal Year Ended
(millions,€except€per€share€data) 2015 2014 2013 2012€(a) 2011 2010
Sales (b) $73,785 $72,618 $71,279 $73,301 $69,865 $67,390
Net Earnings / (Loss)
Continuing operations 3,321 2,449 2,694 3,315 3,049 2,920
Discontinued operations 42 (4,085)(723)(316)(120)—
Net earnings / (loss) 3,363 (1,636)1,971 2,999 2,929 2,920
Basic Earnings / (Loss) Per Share
Continuing operations 5.29 3.86 4.24 5.05 4.49 4.03
Discontinued operations 0.07 (6.44)(1.14)(0.48)(0.18)—
Basic earnings / (loss) per share 5.35 (2.58)3.10 4.57 4.31 4.03
Diluted Earnings / (Loss) Per Share
Continuing operations 5.25 3.83 4.20 5.00 4.46 4.00
Discontinued operations 0.07 (6.38)(1.13)(0.48)(0.18)—
Diluted earnings / (loss) per share 5.31 (2.56)3.07 4.52 4.28 4.00
Cash dividends declared per share 2.20 1.99 1.65 1.38 1.15 0.92
Total assets (c) 40,262 41,172 44,325 47,878 46,260 43,240
Long-term€debt,€including€current€portion 12,760 12,725 12,494 16,260 16,127 15,638
Note: This information should be read in conjunction with MD&A and the Financial Statements.
(a) Consisted of 53€weeks.
(b) For 2012 and prior, includes sales generated by our retail operations and credit card revenues.
(c) Prior year balances have been revised to reflect the impact of adopting ASU No. 2015-03, Simplifying the Presentation of Debt
Issuance Costs and ASU No. 2015-17, Balance Sheet Classification of Deferred Taxes, described further in Notes 20 and 23 to the
Financial Statements, respectively.
Item€7.€€€Management's Discussion and Analysis of Financial Condition and Results of Operations
Executive Summary
Fiscal 2015 included the following notable items:
• GAAP earnings per share were $5.31, including $0.07 related to discontinued operations.
• Adjusted earnings per share from continuing operations were $4.69.
• Comparable sales grew 2.1 percent. Digital channel sales growth of more than 30 percent contributed 0.8
percentage points to 2015 comparable sales growth.
• We sold our pharmacy and clinic businesses to CVS, recognizing a pretax gain of $620 million.
• We paid dividends of $1,362 million in 2015, an increase of 13.0 percent above 2014.
• We returned cash through share repurchase for the first time since second quarter 2013, with purchases of $3,441
million of common stock at an average price of $77.07 per share.
Sales were $73,785 million for 2015, an increase of $1,167 million or 1.6 percent from the prior year. Earnings from
continuing operations before interest expense and income taxes in 2015 increased by $995 million or 22.0 percent
from 2014 to $5,530 million. Operating cash flow provided by continuing operations was $5,140 million, $5,131 million,
and $7,519 million for 2015, 2014, and 2013, respectively. Proceeds from the sale of our pharmacy and clinic businesses
to CVS are included in investing cash flows provided by continuing operations. In 2013, operating cash flow provided
by continuing operations includes $2.7 billion of proceeds from the sale of our U.S. credit card receivables.
16