Target 2015 Annual Report Download - page 41
Download and view the complete annual report
Please find page 41 of the 2015 Target annual report below. You can navigate through the pages in the report by either clicking on the pages listed below, or by using the keyword search tool below to find specific information within the annual report.-
 1
1 -
2
-
3
-
4
-
5
-
6
-
7
-
8
-
9
-
10
-
11
-
12
-
13
-
14
-
15
-
16
-
17
-
18
-
19
-
20
-
21
-
22
-
23
-
24
-
25
-
26
-
27
-
28
-
29
-
30
-
 31
31 -
 32
32 -
 33
33 -
 34
34 -
 35
35 -
 36
36 -
 37
37 -
 38
38 -
 39
39 -
 40
40 -
 41
41 -
 42
42 -
 43
43 -
 44
44 -
 45
45 -
 46
46 -
 47
47 -
 48
48 -
 49
49 -
 50
50 -
 51
51 -
52
-
53
-
54
-
55
-
56
-
57
-
58
-
59
-
60
-
61
-
62
-
63
-
64
-
65
-
66
-
67
-
68
-
69
-
70
-
71
-
72
-
73
-
74
-
75
-
76
-
77
-
78
-
79
-
80
-
81
-
82
-
83
-
84
 |
 |

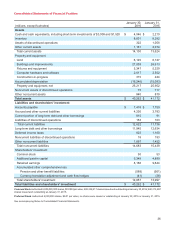
Consolidated Statements of Financial Position
(millions, except footnotes)
January 30,
2016
January 31,
2015
Assets
Cash€and€cash€equivalents,€including€short-term€investments€of€$3,008€and€$1,520 $4,046 $2,210
Inventory 8,601 8,282
Assets of discontinued operations 322 1,058
Other current assets 1,161 2,074
Total current assets 14,130 13,624
Property and equipment
Land 6,125 6,127
Buildings and improvements 27,059 26,613
Fixtures and equipment 5,347 5,329
Computer hardware and software 2,617 2,552
Construction-in-progress 315 424
Accumulated depreciation (16,246)(15,093)
Property and equipment, net 25,217 25,952
Noncurrent assets of discontinued operations 75 717
Other noncurrent assets 840 879
Total assets $40,262 $41,172
Liabilities and shareholders' investment
Accounts payable $7,418 $7,759
Accrued and other current liabilities 4,236 3,783
Current portion of long-term debt and other borrowings 815 91
Liabilities of discontinued operations 153 103
Total current liabilities 12,622 11,736
Long-term debt and other borrowings 11,945 12,634
Deferred income taxes 823 1,160
Noncurrent liabilities of discontinued operations 18 193
Other noncurrent liabilities 1,897 1,452
Total noncurrent liabilities 14,683 15,439
Shareholders' investment
Common stock 50 53
Additional paid-in capital 5,348 4,899
Retained earnings 8,188 9,644
Accumulated other comprehensive loss
Pension and other benefit liabilities (588)(561)
Currency translation adjustment and cash flow hedges (41)(38)
Total shareholders' investment 12,957 13,997
Total liabilities and shareholders' investment $40,262 $41,172
Common Stock Authorized 6,000,000,000 shares, $0.0833 par value; 602,226,517 shares issued and outstanding at January€30, 2016; 640,213,987
shares issued and outstanding at January€31, 2015.
Preferred Stock Authorized 5,000,000 shares, $0.01 par value; no shares were issued or outstanding at January€30, 2016 or January€31, 2015.
See accompanying Notes to Consolidated Financial Statements.
36