Target 2015 Annual Report Download - page 24
Download and view the complete annual report
Please find page 24 of the 2015 Target annual report below. You can navigate through the pages in the report by either clicking on the pages listed below, or by using the keyword search tool below to find specific information within the annual report.-
 1
1 -
2
-
3
-
4
-
5
-
6
-
7
-
8
-
9
-
10
-
11
-
12
-
13
-
 14
14 -
 15
15 -
 16
16 -
 17
17 -
 18
18 -
 19
19 -
 20
20 -
 21
21 -
 22
22 -
 23
23 -
 24
24 -
 25
25 -
 26
26 -
 27
27 -
 28
28 -
 29
29 -
 30
30 -
 31
31 -
 32
32 -
 33
33 -
 34
34 -
35
-
36
-
37
-
38
-
39
-
40
-
41
-
42
-
43
-
44
-
45
-
46
-
47
-
48
-
49
-
50
-
51
-
52
-
53
-
54
-
55
-
56
-
57
-
58
-
59
-
60
-
61
-
62
-
63
-
64
-
65
-
66
-
67
-
68
-
69
-
70
-
71
-
72
-
73
-
74
-
75
-
76
-
77
-
78
-
79
-
80
-
81
-
82
-
83
-
84
 |
 |

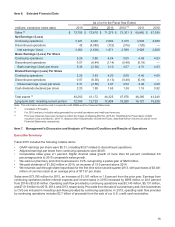
Comparable€Sales 2015 2014 2013
Comparable sales change 2.1%1.3%(0.4)%
Drivers€of€change€in€comparable€sales:
Number of transactions 1.3 (0.2)(2.7)
Average transaction amount 0.8 1.5 2.3
Selling price per unit 3.3 3.2 1.6
Units per transaction (2.4)(1.6)0.7
Contribution to Comparable€Sales Change 2015 2014 2013
Stores channel comparable sales change 1.3% 0.7% (0.7)%
Digital channel contribution to comparable sales change 0.8 0.7 0.3
Total comparable sales change 2.1% 1.3% (0.4)%
Note: Amounts may not foot due to rounding.
Sales by Product Category Percentage of Sales
2015 2014 2013
Household essentials€(a) 26%25%25%
Hardlines€(b) 17 18 18
Apparel and accessories€(c) 19 19 19
Food and pet supplies€(d) 21 21 21
Home furnishings and décor€(e) 17 17 17
Total 100%100%100%
(a) Includes pharmacy, beauty, personal care, baby care, cleaning, and paper products. Pharmacy represented 5 percent, 6 percent, and 6
percent in 2015, 2014, and 2013, respectively.
(b) Includes electronics (including video game hardware and software), music, movies, books, computer software, sporting goods, and toys.
(c) Includes apparel for women, men, boys, girls, toddlers, infants and newborns, as well as intimate apparel, jewelry, accessories, and
shoes.
(d) Includes dry grocery, dairy, frozen food, beverages, candy, snacks, deli, bakery, meat, produce, and pet supplies.
(e) Includes furniture, lighting, kitchenware, small appliances, home décor, bed and bath, home improvement, automotive, and seasonal
merchandise such as patio furniture and holiday décor.
Further analysis of sales metrics is infeasible due to the collective interaction of a broad array of macroeconomic,
competitive, and consumer behavioral factors, as well as sales mix and transfer of sales to new stores.
TD offers credit to qualified guests through Target-branded credit cards: the Target Credit Card and the Target
MasterCard Credit Card (Target Credit Cards). Additionally, we offer a branded proprietary Target Debit Card.
Collectively, we refer to these products as REDcards®. Guests receive a 5 percent discount on virtually all purchases
and free shipping at Target.com when they use a REDcard. We monitor the percentage of sales that are paid for using
REDcards (REDcard Penetration) because our internal analysis has indicated that a meaningful portion of incremental
purchases on our REDcards are also incremental sales for Target.
REDcard Penetration 2015 2014 2013
Target Debit Card 12.1%11.2%9.9%
Target Credit Cards 10.1 9.7 9.3
Total€REDcard€Penetration 22.3%20.9%19.3%
Note: Excluding pharmacy and clinic sales, total REDcard penetration would have been 23.2 percent, 21.9 percent, and 20.1 percent for 2015,
2014, and 2013, respectively. The sum of Target Credit Cards and Target Debit Card penetration may not equal Total REDcard Penetration due to
rounding.
19