Target 2015 Annual Report Download - page 23
Download and view the complete annual report
Please find page 23 of the 2015 Target annual report below. You can navigate through the pages in the report by either clicking on the pages listed below, or by using the keyword search tool below to find specific information within the annual report.-
 1
1 -
2
-
3
-
4
-
5
-
6
-
7
-
8
-
9
-
10
-
11
-
12
-
 13
13 -
 14
14 -
 15
15 -
 16
16 -
 17
17 -
 18
18 -
 19
19 -
 20
20 -
 21
21 -
 22
22 -
 23
23 -
 24
24 -
 25
25 -
 26
26 -
 27
27 -
 28
28 -
 29
29 -
 30
30 -
 31
31 -
 32
32 -
 33
33 -
34
-
35
-
36
-
37
-
38
-
39
-
40
-
41
-
42
-
43
-
44
-
45
-
46
-
47
-
48
-
49
-
50
-
51
-
52
-
53
-
54
-
55
-
56
-
57
-
58
-
59
-
60
-
61
-
62
-
63
-
64
-
65
-
66
-
67
-
68
-
69
-
70
-
71
-
72
-
73
-
74
-
75
-
76
-
77
-
78
-
79
-
80
-
81
-
82
-
83
-
84
 |
 |

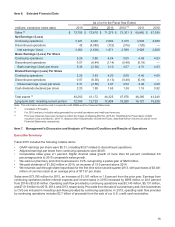
Analysis of Results of Operations
Segment Results
Percent Change
(dollars in millions) 2015 2014 2013 2015/2014 2014/2013
Sales $ 73,785 $ 72,618 $ 71,279 1.6% 1.9 %
Cost of sales 51,997 51,278 50,039 1.4 2.5
Gross margin 21,788 21,340 21,240 2.1 0.5
SG&A expenses€(a) 14,448 14,503 14,383 (0.4) 0.8
EBITDA 7,340 6,837 6,857 7.4 (0.3)
Depreciation€and€amortization 2,213 2,129 1,996 3.9 6.7
EBIT $ 5,127 $ 4,708 $ 4,861 8.9% (3.1)%
Note: Effective January 15, 2015, we operate as a single segment which includes all of our continuing operations, excluding net interest expense,
data breach related costs, and certain other expenses which are discretely managed. Our segment operations are designed to enable guests to
purchase products seamlessly in stores or through our digital sales channels. Beginning with the first quarter of 2015, segment EBIT includes the
impact of the reduction of the beneficial interest asset. For comparison purposes, prior years' segment EBIT has been revised. See Note€30 of our
Financial Statements for a reconciliation of our segment results to earnings before income taxes.
(a) SG&A includes credit card revenues and expenses for all periods presented prior to the March 2013 sale of our U.S. consumer credit
card portfolio to TD. For 2015, 2014, and 2013, SG&A also includes $641 million, $629 million, and $555 million, respectively, of net
profit-sharing income from the arrangement with TD.
Rate€Analysis 2015 2014 2013
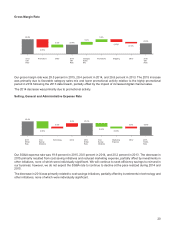
Gross margin rate 29.5%29.4%29.8%
SG&A expense rate 19.6 20.0 20.2
EBITDA margin rate 9.9 9.4 9.6
Depreciation and amortization expense rate 3.0 2.9 2.8
EBIT margin rate 6.9 6.5 6.8
Note: Rate analysis metrics are computed by dividing the applicable amount by sales.
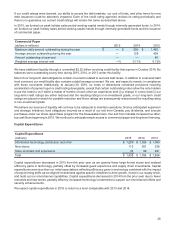
Sales
Sales include merchandise sales, net of expected returns, and gift card breakage. Refer to Note€2 of the Financial
Statements for a definition of gift card breakage. The increase in 2015 and 2014 sales reflects an increase in comparable
sales of 2.1 percent and 1.3 percent, respectively, and the contribution from new stores, partially offset by a decrease
in 2015 of approximately $550 million due to the sale of our pharmacy and clinic businesses. Inflation did not materially
affect sales in any period presented.
Sales by Channel 2015 2014 2013
Stores 96.6%97.4%98.0%
Digital 3.4 2.6 2.0
Total 100%100%100%
Comparable sales is a measure that highlights the performance of our existing stores and digital channel sales by
measuring the change in sales for a period over the comparable, prior-year period of equivalent length. Comparable
sales include all sales, except sales from stores open less than 13 months, digital acquisitions operating less than one
year, stores that have been closed, and digital acquisitions that we no longer operate. Pharmacy and clinic sales for
the comparable period following the sale to CVS are excluded from the calculation. Comparable sales measures vary
across the retail industry. As a result, our comparable sales calculation is not necessarily comparable to similarly titled
measures reported by other companies.
18