Target 2015 Annual Report Download - page 26
Download and view the complete annual report
Please find page 26 of the 2015 Target annual report below. You can navigate through the pages in the report by either clicking on the pages listed below, or by using the keyword search tool below to find specific information within the annual report.-
 1
1 -
2
-
3
-
4
-
5
-
6
-
7
-
8
-
9
-
10
-
11
-
12
-
13
-
14
-
15
-
 16
16 -
 17
17 -
 18
18 -
 19
19 -
 20
20 -
 21
21 -
 22
22 -
 23
23 -
 24
24 -
 25
25 -
 26
26 -
 27
27 -
 28
28 -
 29
29 -
 30
30 -
 31
31 -
 32
32 -
 33
33 -
 34
34 -
 35
35 -
 36
36 -
37
-
38
-
39
-
40
-
41
-
42
-
43
-
44
-
45
-
46
-
47
-
48
-
49
-
50
-
51
-
52
-
53
-
54
-
55
-
56
-
57
-
58
-
59
-
60
-
61
-
62
-
63
-
64
-
65
-
66
-
67
-
68
-
69
-
70
-
71
-
72
-
73
-
74
-
75
-
76
-
77
-
78
-
79
-
80
-
81
-
82
-
83
-
84
 |
 |

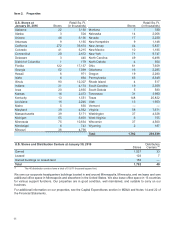
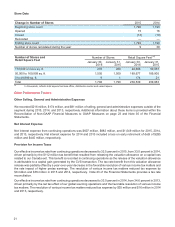
Store Data
Change in Number of Stores 2015 2014
Beginning store count 1,790 1,793
Opened 15 16
Closed (13) (19)
Relocated — —
Ending€store€count 1,792 1,790
Number€of€stores€remodeled€during€the€year 9 39
Number of Stores and
Retail Square Feet Number of Stores Retail Square Feet (a)
January 30,
2016
January 31,
2015
January 30,
2016
January 31,
2015
170,000 or more sq. ft. 278 280 49,688 50,037
50,000 to 169,999 sq. ft. 1,505 1,509 189,677 189,905
0 to 49,999 sq. ft. 9 1 174 21
Total 1,792 1,790 239,539 239,963
(a) In thousands, reflects total square feet less office, distribution center and vacant space.
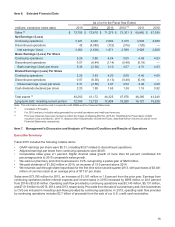
Other Performance Factors
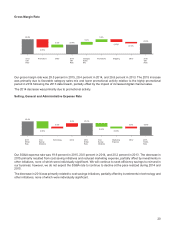
Other Selling, General and Administrative Expenses
We recorded $216 million, $174 million, and $81 million of selling, general and administrative expenses outside of the
segment during 2015, 2014, and 2013, respectively. Additional information about these items is provided within the
Reconciliation of Non-GAAP Financial Measures to GAAP Measures on page 23 and Note 30 of the Financial
Statements.
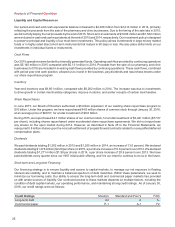
Net Interest Expense
Net interest expense from continuing operations was $607 million, $882 million, and $1,049 million for 2015, 2014,
and 2013, respectively. Net interest expense for 2014 and 2013 included a loss on early retirement of debt of $285
million and $445 million, respectively.
Provision for Income Taxes
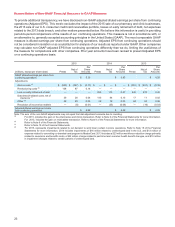
Our effective income tax rate from continuing operations decreased to 32.5€percent in 2015, from 33.0€percent in 2014,
driven primarily by the $112 million tax benefit that resulted from releasing the valuation allowance on a capital loss
related to our Canada exit. This benefit is recorded in continuing operations as the release of the valuation allowance
is attributable to a capital gain generated by the CVS transaction. The tax rate benefit from this valuation allowance
release was partially offset by a year-over-year decrease in the favorable resolution of various income tax matters and
the rate impact of higher pretax earnings. The resolution of various income tax matters reduced tax expense by
$8€million and $35€million in 2015 and 2014, respectively. Note€23 of the Financial Statements provides a tax rate
reconciliation.
Our effective income tax rate from continuing operations decreased to 33.0€percent in 2014, from 34.6€percent in 2013,
driven primarily by the net tax effect of our global sourcing operations and the favorable resolution of various income
tax matters. The resolution of various income tax matters reduced tax expense by $35€million and $16€million in 2014
and 2013, respectively.
21