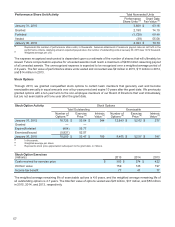
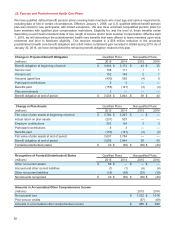
Target 2015 Annual Report Download - page 67
Download and view the complete annual report
Please find page 67 of the 2015 Target annual report below. You can navigate through the pages in the report by either clicking on the pages listed below, or by using the keyword search tool below to find specific information within the annual report.-
 1
1 -
2
-
3
-
4
-
5
-
6
-
7
-
8
-
9
-
10
-
11
-
12
-
13
-
14
-
15
-
16
-
17
-
18
-
19
-
20
-
21
-
22
-
23
-
24
-
25
-
26
-
27
-
28
-
29
-
30
-
31
-
32
-
33
-
34
-
35
-
36
-
37
-
38
-
39
-
40
-
41
-
42
-
43
-
44
-
45
-
46
-
47
-
48
-
49
-
50
-
51
-
52
-
53
-
54
-
55
-
56
-
 57
57 -
 58
58 -
 59
59 -
 60
60 -
 61
61 -
 62
62 -
 63
63 -
 64
64 -
 65
65 -
 66
66 -
 67
67 -
 68
68 -
 69
69 -
 70
70 -
 71
71 -
 72
72 -
 73
73 -
 74
74 -
 75
75 -
 76
76 -
 77
77 -
78
-
79
-
80
-
81
-
82
-
83
-
84
 |
 |

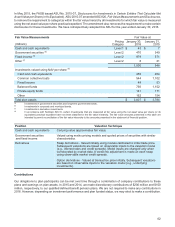
In May 2015, the FASB issued ASU No. 2015-07, Disclosures for Investments in Certain Entities That Calculate Net
Asset Value per Share (or Its Equivalent). ASU 2015-07 amended ASC 820, Fair Value Measurements and Disclosures,
to remove the requirement to categorize within the fair value hierarchy all investments for which fair value is measured
using the net asset value per share practical expedient. The amendment also removes the requirement to make certain
disclosures for these investments. We have retrospectively adopted this ASU for the year ended January 30, 2016.
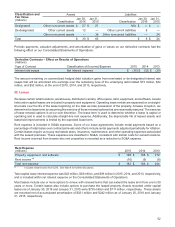
Fair€Value€Measurements Fair€Value€at
(millions) Pricing
Category
January 30,
2016
January 31,
2015
Cash and cash equivalents Level 1 $43 $7
Government securities€(a) Level 2 470 349
Fixed income€(b) Level 2 979 571
Other (c) Level 2 8 21
1,500 948
Investments valued using NAV per share (d)
Cash and cash equivalents 455 204
Common collective trusts 544 1,102
Fixed Income 49 53
Balanced funds 756 1,152
Private equity funds 141 171
Other 162 154
Total plan assets $3,607 $3,784
(a) Investments in government securities and long-term government bonds.
(b) Investments in corporate and municipal bonds.
(c) Investments in derivative investments.
(d) In accordance with Subtopic 820-10, certain investments that are measured at fair value using the net asset value per share (or its
equivalent) practical expedient have not been classified in the fair value hierarchy. The fair value amounts presented in this table are
intended to permit reconciliation of the fair value hierarchy to the amounts presented in the statement of financial position.
Position Valuation Technique
Cash€and€cash€equivalents Carrying value approximates fair value.
Government securities
and fixed income
Valued using matrix pricing models and quoted prices of securities with similar
characteristics.
Derivatives Swap derivatives - Valued initially using models calibrated to initial trade price.
Subsequent valuations are based on observable inputs to the valuation model
(e.g., interest rates and credit spreads). Model inputs are changed only when
corroborated by market data. A credit risk adjustment is made on each swap
using observable market credit spreads.
Option derivatives - Valued at transaction price initially. Subsequent valuations
are based on observable inputs to the valuation model (e.g., underlying
investments).
Contributions
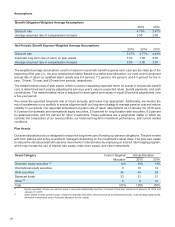
Our obligations to plan participants can be met over time through a combination of company contributions to these
plans and earnings on plan assets. In 2015 and 2014, we made discretionary contributions of $200 million and $150
million, respectively, to our qualified defined benefit pension plans. We are not required to make any contributions in
2016. However, depending on investment performance and plan funded status, we may elect to make a contribution.
62