Target 2015 Annual Report Download - page 33
Download and view the complete annual report
Please find page 33 of the 2015 Target annual report below. You can navigate through the pages in the report by either clicking on the pages listed below, or by using the keyword search tool below to find specific information within the annual report.-
 1
1 -
2
-
3
-
4
-
5
-
6
-
7
-
8
-
9
-
10
-
11
-
12
-
13
-
14
-
15
-
16
-
17
-
18
-
19
-
20
-
21
-
22
-
 23
23 -
 24
24 -
 25
25 -
 26
26 -
 27
27 -
 28
28 -
 29
29 -
 30
30 -
 31
31 -
 32
32 -
 33
33 -
 34
34 -
 35
35 -
 36
36 -
 37
37 -
 38
38 -
 39
39 -
 40
40 -
 41
41 -
 42
42 -
 43
43 -
44
-
45
-
46
-
47
-
48
-
49
-
50
-
51
-
52
-
53
-
54
-
55
-
56
-
57
-
58
-
59
-
60
-
61
-
62
-
63
-
64
-
65
-
66
-
67
-
68
-
69
-
70
-
71
-
72
-
73
-
74
-
75
-
76
-
77
-
78
-
79
-
80
-
81
-
82
-
83
-
84
 |
 |

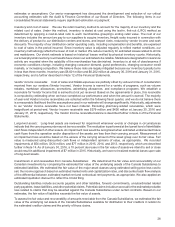
estimates or assumptions. Our senior management has discussed the development and selection of our critical
accounting estimates with the Audit & Finance Committee of our Board of Directors. The following items in our
consolidated financial statements require significant estimation or judgment:
Inventory and cost of sales:€€€€We use the retail inventory method to account for the majority of our inventory and the
related cost of sales. Under this method, inventory is stated at cost using the last-in, first-out (LIFO) method as
determined by applying a cost-to-retail ratio to each merchandise grouping's ending retail value. The cost of our
inventory includes the amount we pay to our suppliers to acquire inventory, freight costs incurred in connection with
the delivery of product to our distribution centers and stores, and import costs, reduced by vendor income and cash
discounts. The majority of our distribution center operating costs, including compensation and benefits, are expensed
to cost of sales in the period incurred. Since inventory value is adjusted regularly to reflect market conditions, our
inventory methodology reflects the lower of cost or market. We reduce inventory for estimated losses related to shrink
and markdowns. Our shrink estimate is based on historical losses verified by physical inventory counts. Historically,
our actual physical inventory count results have shown our estimates to be reliable. Markdowns designated for clearance
activity are recorded when the salability of the merchandise has diminished. Inventory is at risk of obsolescence if
economic conditions change, including changing consumer demand, guest preferences, changing consumer credit
markets, or increasing competition. We believe these risks are largely mitigated because our inventory typically turns
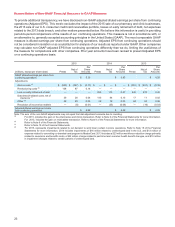
in less than three months. Inventory was $8,601 million and $8,282 million at January€30, 2016 and January€31, 2015,
respectively, and is further described in Note€12 of the Financial Statements.
Vendor income receivable:€€€€Cost of sales and SG&A expenses are partially offset by various forms of consideration
received from our vendors (Vendor Income). Vendor Income is earned for a variety of programs, such as volume
rebates, markdown allowances, promotions, advertising allowances, and compliance programs. We establish a
receivable for Vendor Income that is earned but not yet received. Based on the agreements in place, this receivable
is computed by estimating when we have completed our performance and when the amount is earned. The majority
of year-end Vendor Income receivables are collected within the following fiscal quarter, and we do not believe there
is a reasonable likelihood that the assumptions used in our estimate will change significantly. Historically, adjustments
to our Vendor Income receivable have not been material. Excluding pharmacy-related receivables, which were
insignificant at period-end, Vendor Income receivable was $379 million and $426 million at January€30, 2016 and
January€31, 2015, respectively. The Vendor Income receivable balance is described further in Note€4 of the Financial
Statements.
Long-lived assets:€€€€Long-lived assets are reviewed for impairment whenever events or changes in circumstances
indicate that the carrying amounts may not be recoverable. The evaluation is performed at the lowest level of identifiable
cash flows independent of other assets. An impairment loss would be recognized when estimated undiscounted future
cash flows from the operation and/or disposition of the assets are less than their carrying amount. Measurement of
an impairment loss would be based on the excess of the carrying amount of the asset group over its fair value. Fair
value is measured using discounted cash flows or independent opinions of value, as appropriate. We recorded
impairments of $54 million, $124 million, and $77 million in 2015, 2014, and 2013, respectively, which are described
further in Note 14. As of January€30, 2016, a 10€percent decrease in the fair value of assets we intend to sell or close
would result in additional impairment of $7€million in 2015. Historically, we have not realized material losses upon sale
of long-lived assets.
Investments in and receivables from Canada Subsidiaries:€€€€We determined the fair value and recoverability of our
Canadian investments by comparing the estimated fair value of the underlying assets of the Canada Subsidiaries to
estimated liabilities. We estimated the fair value of the major asset classes using estimated selling price less cost to
sell, the income approach based on estimated market rents and capitalization rates, and discounted cash flow analysis
of the differential between estimated market rent and contractual rent payments, as appropriate. We also applied an
estimated liquidation discount to reflect the CCAA filing.
Outstanding liabilities include accounts payable and other liabilities, forward commitments, unsubordinated related
party payables, lease liabilities, and other potential claims. Potential claims include an accrual for the estimated probable
loss related to claims that may be asserted against the Canada Subsidiaries under certain contracts. Based on our
estimates, the fair value of liabilities exceeds the fair value of assets.
To assess the fair value and recoverability of amounts receivable from the Canada Subsidiaries, we estimated the fair
value of the underlying net assets of the Canada Subsidiaries available for distribution to their creditors in relation to
the estimated creditor claims and the priority of those claims.
28