Target 2015 Annual Report Download - page 66
Download and view the complete annual report
Please find page 66 of the 2015 Target annual report below. You can navigate through the pages in the report by either clicking on the pages listed below, or by using the keyword search tool below to find specific information within the annual report.-
 1
1 -
2
-
3
-
4
-
5
-
6
-
7
-
8
-
9
-
10
-
11
-
12
-
13
-
14
-
15
-
16
-
17
-
18
-
19
-
20
-
21
-
22
-
23
-
24
-
25
-
26
-
27
-
28
-
29
-
30
-
31
-
32
-
33
-
34
-
35
-
36
-
37
-
38
-
39
-
40
-
41
-
42
-
43
-
44
-
45
-
46
-
47
-
48
-
49
-
50
-
51
-
52
-
53
-
54
-
55
-
 56
56 -
 57
57 -
 58
58 -
 59
59 -
 60
60 -
 61
61 -
 62
62 -
 63
63 -
 64
64 -
 65
65 -
 66
66 -
 67
67 -
 68
68 -
 69
69 -
 70
70 -
 71
71 -
 72
72 -
 73
73 -
 74
74 -
 75
75 -
 76
76 -
77
-
78
-
79
-
80
-
81
-
82
-
83
-
84
 |
 |

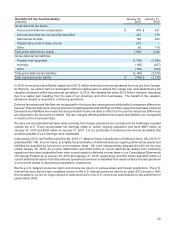
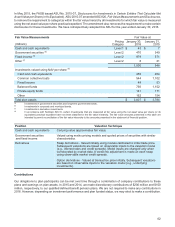
Assumptions
Benefit Obligation Weighted Average Assumptions
2015 2014
Discount rate 4.70% 3.87%
Average€assumed€rate€of€compensation€increase 3.00 3.00
Net Periodic Benefit Expense Weighted Average Assumptions
2015 2014 2013
Discount rate 3.87%4.77%4.40%
Expected long-term rate of return on plan assets 7.50 7.50 8.00
Average€assumed€rate€of€compensation€increase 3.00 3.00 3.00
The weighted average assumptions used to measure net periodic benefit expense each year are the rates as of the
beginning of the year (i.e.,€the prior measurement date). Based on a stable asset allocation, our most recent compound
annual rate of return on qualified plans' assets was 8.4 percent, 7.2 percent, 6.8 percent, and 8.5 percent for the 5-
year, 10-year, 15-year, and 20-year time periods, respectively.
The market-related value of plan assets, which is used in calculating expected return on assets in net periodic benefit
cost, is determined each year by adjusting the previous year's value by expected return, benefit payments, and cash
contributions. The market-related value is adjusted for asset gains and losses in equal 20 percent adjustments over
a five-year period.
We review the expected long-term rate of return annually, and revise it as appropriate. Additionally, we monitor the
mix of investments in our portfolio to ensure alignment with our long-term strategy to manage pension cost and reduce
volatility in our assets. Our expected annualized long-term rate of return assumptions as of January€30, 2016 were
8.0 percent for domestic and international equity securities, 5.0 percent for long-duration debt securities, 8.0 percent
for balanced funds, and 9.5 percent for other investments. These estimates are a judgmental matter in which we
consider the composition of our asset portfolio, our historical long-term investment performance, and current market
conditions.
Plan Assets
Our asset allocation policy is designed to reduce the long-term cost of funding our pension obligations. The plan invests
with both passive and active investment managers depending on the investment's asset class. The plan also seeks
to reduce the risk associated with adverse movements in interest rates by employing an interest rate hedging program,
which may include the use of interest rate swaps, total return swaps, and other instruments.
Asset€Category Current€Targeted Actual Allocation
Allocation 2015 2014
Domestic€equity€securities€(a) 14%16%19%
International equity securities 9 10 12
Debt securities 45 44 28
Balanced funds 23 21 31
Other€(b) 9 9 10
Total 100%100%100%
(a) Equity securities include our common stock in amounts substantially less than 1 percent of total plan assets as of January€30, 2016 and
January€31, 2015.
(b) Other assets include private equity, mezzanine and high-yield debt, natural resources and timberland funds, multi-strategy hedge funds,
derivative instruments, and a 4 percent allocation to real estate.
61