Target 2015 Annual Report Download - page 4
Download and view the complete annual report
Please find page 4 of the 2015 Target annual report below. You can navigate through the pages in the report by either clicking on the pages listed below, or by using the keyword search tool below to find specific information within the annual report.-
 1
1 -
 2
2 -
 3
3 -
 4
4 -
 5
5 -
 6
6 -
 7
7 -
 8
8 -
 9
9 -
 10
10 -
 11
11 -
 12
12 -
 13
13 -
 14
14 -
 15
15 -
16
-
17
-
18
-
19
-
20
-
21
-
22
-
23
-
24
-
25
-
26
-
27
-
28
-
29
-
30
-
31
-
32
-
33
-
34
-
35
-
36
-
37
-
38
-
39
-
40
-
41
-
42
-
43
-
44
-
45
-
46
-
47
-
48
-
49
-
50
-
51
-
52
-
53
-
54
-
55
-
56
-
57
-
58
-
59
-
60
-
61
-
62
-
63
-
64
-
65
-
66
-
67
-
68
-
69
-
70
-
71
-
72
-
73
-
74
-
75
-
76
-
77
-
78
-
79
-
80
-
81
-
82
-
83
-
84
 |
 |
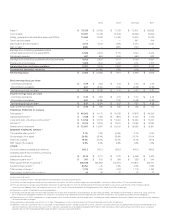
Financial Summary Target 2015 Annual Report
2015 2014 2013 2012 (a) 2011
FINANCIAL RESULTS: (in millions)
Sales (b) $ 73,785 $ 72,618 $ 71,279 $ 73,301 $ 69,865
Cost of sales 51,997 51,278 50,039 50,568 47,860
Selling, general and administrative expenses (SG&A) 14,665 14,676 14,465 14,643 14,032
Credit card expenses — — — 467 446
Depreciation and amortization 2,213 2,129 1,996 2,044 2,084
Gain on sale (c) (620) — (391) (161) —
Earnings from continuing operations before
interest expense and income taxes (EBIT) 5,530 4,535 5,170 5,740 5,443
Net interest expense 607 882 1,049 684 822
Earnings from continuing operations before income taxes 4,923 3,653 4,121 5,056 4,621
Provision for income taxes 1,602 1,204 1,427 1,741 1,572
Net earnings from continuing operations 3,321 2,449 2,694 3,315 3,049
Discontinued operations, net of tax 42 (4,085) (723) (316) (120)
Net earnings /(loss) $ 3,363 $ (1,636) $ 1,971 $ 2,999 $ 2,929
PER SHARE:
Basic earnings/(loss) per share
Continuing operations $ 5.29 $ 3.86 $ 4.24 $ 5.05 $ 4.49
Discontinued operations 0.07 (6.44) (1.14) (0.48) (0.18)
Net earnings/(loss) per share $ 5.35 $ (2.58) $ 3.10 $ 4.57 $ 4.31
Diluted earnings/(loss) per share
Continuing operations $ 5.25 $ 3.83 $ 4.20 $ 5.00 $ 4.46
Discontinued operations 0.07 (6.38) (1.13) (0.48) (0.18)
Net earnings/(loss) per share $ 5.31 $ (2.56) $ 3.07 $ 4.52 $ 4.28
Cash dividends declared $ 2.20 $ 1.99 $ 1.65 $ 1.38 $ 1.15
FINANCIAL POSITION: (in millions)
Total assets (d) $ 40,262 $ 41,172 $ 44,325 $ 47,878 $ 46,260
Capital expenditures (e) $ 1,438 $ 1,786 $ 1,886 $ 2,345 $ 2,476
Long-term debt, including current portion (e) $ 12,760 $ 12,725 $ 12,494 $ 16,260 $ 16,127
Net debt (e)(f) $ 9,752 $ 11,205 $ 12,491 $ 16,185 $ 15,983
Shareholders’ investment $ 12,957 $ 13,997 $ 16,231 $ 16,558 $ 15,821
SEGMENT FINANCIAL RATIOS: (g)
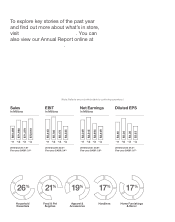
Comparable sales growth (h) 2.1% 1.3% (0.4)% 2.7% 3.0%
Gross margin (% of sales) 29.5% 29.4% 29.8% 29.7% 30.1%
SG&A (% of sales) 19.6% 20.0% 20.2% 19.1% 19.1%
EBIT margin (% of sales) 6.9% 6.5% 6.8% 7.8% 7.9%
OTHER:
Common shares outstanding (in millions) 602.2 640.2 632.9 645.3 669.3
Operating cash flow provided by continuing
operations (in millions) $ 5,140 $ 5,131 $ 7,519 $ 5,568 $ 5,520
Sales per square foot (e)(i) $ 307 $ 302 $ 298 $ 299 $ 294
Retail square feet (in thousands) (e) 239,539 239,963 240,054 237,847 235,721
Square footage growth (e) (0.2%) —% 0.9% 0.9% 0.9%
Total number of stores (e) 1,792 1,790 1,793 1,778 1,763
Total number of distribution centers (e) 40 38 37 37 37
(a) Consisted of 53 weeks.
(b) For 2012 and prior, includes sales generated by retail operations and credit card revenues.
(c) For 2015, includes the gain on the pharmacies and clinics transaction. For 2013, includes the gain on the receivables transaction. Refer to Form 10-K for more information.
(d) Prior year balances have been revised to reflect the impact of adopting ASU No. 2015-03, Simplifying the Presentation of Debt Issuance Costs and ASU No. 2015-17, Balance Sheet
Classification of Deferred Taxes, described further in Form 10-K, Item 8, Financial Statements and Supplementary Data, Notes 20 and 23, respectively.
(e) Represents amounts attributable to continuing operations.
(f) Including current portion and short-term notes payable, net of short-term investments of $3,008 million, $1,520 million, $3 million, $75 million and $144 million in 2015, 2014, 2013, 2012 and
2011, respectively. Management believes this measure is an indicator of our level of financial leverage because short-term investments are available to pay debt maturity obligations.
(g) Effective January 15, 2015, we operate as a single segment which includes all of our continuing operations, excluding net interest expense, data breach related costs and certain other expenses
which are discretely managed.
(h) See definition of comparable sales in Form 10-K, Item 7, Management’s Discussion and Analysis of Financial Condition and Results of Operations.
(i) Represents sales per square foot which is calculated using rolling four quarters average square feet. In 2015, sales per square feet decreased by approximately $2 due to the December 2015
sale of our pharmacy and clinic businesses. In 2012, sales per square foot was calculated excluding the 53rd week in order to provide a more useful comparison to other years. Using total
reported sales for 2012 (including the 53rd week) resulted in sales per square foot of $304.