Target 2015 Annual Report Download - page 31
Download and view the complete annual report
Please find page 31 of the 2015 Target annual report below. You can navigate through the pages in the report by either clicking on the pages listed below, or by using the keyword search tool below to find specific information within the annual report.-
 1
1 -
2
-
3
-
4
-
5
-
6
-
7
-
8
-
9
-
10
-
11
-
12
-
13
-
14
-
15
-
16
-
17
-
18
-
19
-
20
-
 21
21 -
 22
22 -
 23
23 -
 24
24 -
 25
25 -
 26
26 -
 27
27 -
 28
28 -
 29
29 -
 30
30 -
 31
31 -
 32
32 -
 33
33 -
 34
34 -
 35
35 -
 36
36 -
 37
37 -
 38
38 -
 39
39 -
 40
40 -
 41
41 -
42
-
43
-
44
-
45
-
46
-
47
-
48
-
49
-
50
-
51
-
52
-
53
-
54
-
55
-
56
-
57
-
58
-
59
-
60
-
61
-
62
-
63
-
64
-
65
-
66
-
67
-
68
-
69
-
70
-
71
-
72
-
73
-
74
-
75
-
76
-
77
-
78
-
79
-
80
-
81
-
82
-
83
-
84
 |
 |

If our credit ratings were lowered, our ability to access the debt markets, our cost of funds, and other terms for new
debt issuances could be adversely impacted. Each of the credit rating agencies reviews its rating periodically and
there is no guarantee our current credit ratings will remain the same as described above.
In 2015, we funded our peak holiday sales period working capital needs through internally generated funds. In 2014,
we funded our peak holiday sales period working capital needs through internally generated funds and the issuance
of commercial paper.
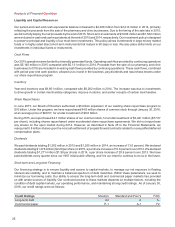
Commercial Paper
(dollars in millions) 2015 2014 2013
Maximum€daily€amount€outstanding€during€the€year $ — $ 590 $ 1,465
Average amount outstanding during the year — 129 408
Amount outstanding at year-end — — 80
Weighted average interest rate —% 0.11% 0.13%
We have additional liquidity through a committed $2.25€billion revolving credit facility that expires in October 2018. No
balances were outstanding at any time during 2015, 2014, or 2013 under this facility.
Most of our long-term debt obligations contain covenants related to secured debt levels. In addition to a secured debt
level covenant, our credit facility also contains a debt leverage covenant. We are, and expect to remain, in compliance
with these covenants. Additionally, at January€30, 2016, no notes or debentures contained provisions requiring
acceleration of payment upon a credit rating downgrade, except that certain outstanding notes allow the note holders
to put the notes to us if within a matter of months of each other we experience both (i)€a change in control and (ii)€our
long-term credit ratings are either reduced and the resulting rating is non-investment grade, or our long-term credit
ratings are placed on watch for possible reduction and those ratings are subsequently reduced and the resulting rating
is non-investment grade.
We believe our sources of liquidity will continue to be adequate to maintain operations, finance anticipated expansion
and strategic initiatives, fund obligations incurred as a result of our exit from Canada, pay dividends, and execute
purchases under our share repurchase program for the foreseeable future. Our exit from Canada increased our after-
tax cash flows beginning in 2015. We continue to anticipate ample access to commercial paper and long-term financing.
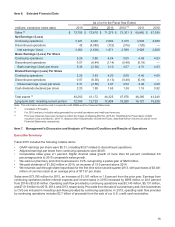
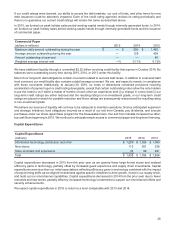
Capital Expenditures
Capital Expenditures
2015 2014 2013(millions)
Information technology, distribution and other $1,289 $1,306 $1,069
New stores 115 381 536
Store remodels and expansions 34 99 281
Total $1,438 $1,786 $1,886
Capital expenditures decreased in 2015 from the prior year as we opened fewer large-format stores and realized
efficiency gains in technology, partially offset by increased guest experience and supply chain investments.€Capital
expenditures were less than our initial expectations reflecting efficiency gains in technology combined with the impact
of project timing shifts as we aligned investments against specific initiatives to drive growth, invest in our supply chain,
and build out our omnichannel capabilities. Capital expenditures decreased in 2014 from the prior year due to fewer
remodels and new stores, partially offset by increased technology investments to support our omnichannel efforts and
security enhancements.
We expect capital expenditures in 2016 to return to a level comparable with 2013 and 2014.
26