Target 2015 Annual Report Download - page 28
Download and view the complete annual report
Please find page 28 of the 2015 Target annual report below. You can navigate through the pages in the report by either clicking on the pages listed below, or by using the keyword search tool below to find specific information within the annual report.-
 1
1 -
2
-
3
-
4
-
5
-
6
-
7
-
8
-
9
-
10
-
11
-
12
-
13
-
14
-
15
-
16
-
17
-
 18
18 -
 19
19 -
 20
20 -
 21
21 -
 22
22 -
 23
23 -
 24
24 -
 25
25 -
 26
26 -
 27
27 -
 28
28 -
 29
29 -
 30
30 -
 31
31 -
 32
32 -
 33
33 -
 34
34 -
 35
35 -
 36
36 -
 37
37 -
 38
38 -
39
-
40
-
41
-
42
-
43
-
44
-
45
-
46
-
47
-
48
-
49
-
50
-
51
-
52
-
53
-
54
-
55
-
56
-
57
-
58
-
59
-
60
-
61
-
62
-
63
-
64
-
65
-
66
-
67
-
68
-
69
-
70
-
71
-
72
-
73
-
74
-
75
-
76
-
77
-
78
-
79
-
80
-
81
-
82
-
83
-
84
 |
 |

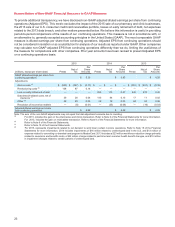
Reconciliation of Non-GAAP Financial Measures to GAAP Measures
To provide additional transparency, we have disclosed non-GAAP adjusted diluted earnings per share from continuing
operations (Adjusted EPS). This metric excludes the impact of the 2015 sale of our pharmacy and clinic businesses,
the 2013 sale of our U.S. consumer credit card receivables portfolio, losses on early retirement of debt, net expenses
related to the 2013 data breach, and other matters presented below. We believe this information is useful in providing
period-to-period comparisons of the results of our continuing operations. This measure is not in accordance with, or
an alternative to, generally accepted accounting principles in the United States (GAAP). The most comparable GAAP
measure is diluted earnings per share from continuing operations. Adjusted EPS from continuing operations should
not be considered in isolation or as a substitution for analysis of our results as reported under GAAP. Other companies
may calculate non-GAAP adjusted EPS from continuing operations differently than we do, limiting the usefulness of
the measure for comparisons with other companies. Prior year amounts have been revised to present Adjusted EPS
on a continuing operations basis.
2015 2014 2013
(millions, except per share data) Pretax
Net of
Tax
Per
Share
Amounts Pretax
Net of
Tax
Per
Share
Amounts Pretax
Net of
Tax
Per
Share
Amounts
GAAP diluted earnings per share from
continuing operations $5.25 $3.83 $4.20
Adjustments
Gain on sale (a) $(620) $ (487) $ (0.77) $ —$—$—$(391) $ (247) $ (0.38)
Restructuring costs (b) 138 87 0.14 — — — — — —
Loss on early retirement of debt — — — 285 173 0.27 445 270 0.42
Data breach-related costs, net of
insurance (c) 39 28 0.04 145 94 0.15 17 11 0.02
Other (d) 39 29 0.05 29 18 0.03 64 40 0.06
Resolution of income tax matters — (8) (0.01) — (35) (0.06) — (16) (0.03)
Adjusted diluted earnings per share
from continuing operations $4.69 $4.22 $4.29
Note: The sum of the non-GAAP adjustments may not equal the total adjustment amounts due to rounding.
(a) For 2015, includes the gain on the pharmacies and clinics transaction. Refer to Note 6 of the Financial Statements for more information.
For 2013, includes the gain on receivables transaction. Refer to Note 9 of the Financial Statements for more information.
(b) Refer to Note 8 of the Financial Statements.
(c) Refer to Note 19 of the Financial Statements.
(d) For 2015, represents impairments related to our decision to wind down certain noncore operations. Refer to Note 16 of the Financial
Statements for more information. 2014 includes impairments of $16 million related to undeveloped land in the U.S. and $13 million of
expense related to converting co-branded card program to MasterCard. 2013 includes a $23 million workforce-reduction charge primarily
related to severance and benefits costs, a $22 million charge related to part-time team member health benefit changes, and $19 million
in impairment charges related to certain parcels of undeveloped land.
23