Target 2015 Annual Report Download - page 30
Download and view the complete annual report
Please find page 30 of the 2015 Target annual report below. You can navigate through the pages in the report by either clicking on the pages listed below, or by using the keyword search tool below to find specific information within the annual report.-
 1
1 -
2
-
3
-
4
-
5
-
6
-
7
-
8
-
9
-
10
-
11
-
12
-
13
-
14
-
15
-
16
-
17
-
18
-
19
-
 20
20 -
 21
21 -
 22
22 -
 23
23 -
 24
24 -
 25
25 -
 26
26 -
 27
27 -
 28
28 -
 29
29 -
 30
30 -
 31
31 -
 32
32 -
 33
33 -
 34
34 -
 35
35 -
 36
36 -
 37
37 -
 38
38 -
 39
39 -
 40
40 -
41
-
42
-
43
-
44
-
45
-
46
-
47
-
48
-
49
-
50
-
51
-
52
-
53
-
54
-
55
-
56
-
57
-
58
-
59
-
60
-
61
-
62
-
63
-
64
-
65
-
66
-
67
-
68
-
69
-
70
-
71
-
72
-
73
-
74
-
75
-
76
-
77
-
78
-
79
-
80
-
81
-
82
-
83
-
84
 |
 |

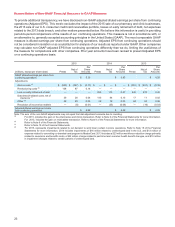
Analysis of Financial Condition
Liquidity and Capital Resources
Our period-end cash and cash equivalents balance increased to $4,046 million from $2,210 million in 2014, primarily
reflecting the proceeds from the sale of the pharmacy and clinic businesses. Due to the timing of the sale late in 2015,
we did not fully deploy the net proceeds by the end of 2015. Short-term investments of $3,008€million and $1,520€million
were included in cash and cash equivalents at the end of 2015 and 2014, respectively. Our investment policy is designed
to preserve principal and liquidity of our short-term investments. This policy allows investments in large money market
funds or in highly rated direct short-term instruments that mature in 60€days or less. We also place dollar limits on our
investments in individual funds or instruments.
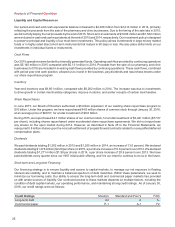
Cash Flows
Our 2015 operations were funded by internally generated funds. Operating cash flow provided by continuing operations
was $5,140 million in 2015 compared with $5,131 million in 2014. Proceeds from the sale of our pharmacy and clinic
businesses to CVS are included in investing cash flows provided by continuing operations. These cash flows, combined
with period year-end cash position, allowed us to invest in the business, pay dividends and repurchase shares under
our share repurchase program.
Inventory
Year-end inventory was $8,601 million, compared with $8,282 million in 2014. The increase was due to investments
to drive growth in certain merchandise categories, improve in-stocks, and earlier receipts of certain merchandise.
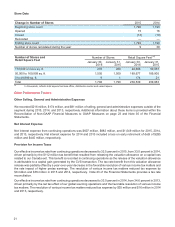
Share Repurchases
In June 2015, our Board of Directors authorized a $5 billion expansion of our existing share repurchase program to
$10 billion. Under this program, we have repurchased 94.6 million shares of common stock through January€30, 2016,
at an average price of $69.57, for a total investment of $6.6 billion.
During 2015, we repurchased 44.7 million shares of our common stock, for a total investment of $3,441 million ($77.07
per share), including shares repurchased under accelerated share repurchase agreements. We did not repurchase
any shares on the open market during 2014. However, as described in Note 25 to the Financial Statements, we
reacquired 0.8 million shares upon the noncash settlement of prepaid forward contracts related to nonqualified deferred
compensation plans.
Dividends
We paid dividends totaling $1,362 million in 2015 and $1,205 million in 2014, an increase of 13.0€percent. We declared
dividends totaling $1,378 million ($2.20 per share) in 2015, a per share increase of 10.6€percent over 2014. We declared
dividends totaling $1,271€million ($1.99 per share) in 2014, a per share increase of 20.6€percent over 2013. We have
paid dividends every quarter since our 1967 initial public offering, and it is our intent to continue to do so in the future.
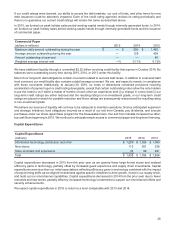
Short-term and Long-term Financing
Our financing strategy is to ensure liquidity and access to capital markets, to manage our net exposure to floating
interest rate volatility, and to maintain a balanced spectrum of debt maturities. Within these parameters, we seek to
minimize our borrowing costs. Our ability to access the long-term debt and commercial paper markets has provided
us with ample sources of liquidity. Our continued access to these markets depends on multiple factors, including the
condition of debt capital markets, our operating performance, and maintaining strong credit ratings. As of January€30,
2016, our credit ratings were as follows:
Credit Ratings Moody's Standard and Poor's Fitch
Long-term debt A2 A A-
Commercial paper P-1 A-1 F2
25