Target 2015 Annual Report Download - page 62
Download and view the complete annual report
Please find page 62 of the 2015 Target annual report below. You can navigate through the pages in the report by either clicking on the pages listed below, or by using the keyword search tool below to find specific information within the annual report.-
 1
1 -
2
-
3
-
4
-
5
-
6
-
7
-
8
-
9
-
10
-
11
-
12
-
13
-
14
-
15
-
16
-
17
-
18
-
19
-
20
-
21
-
22
-
23
-
24
-
25
-
26
-
27
-
28
-
29
-
30
-
31
-
32
-
33
-
34
-
35
-
36
-
37
-
38
-
39
-
40
-
41
-
42
-
43
-
44
-
45
-
46
-
47
-
48
-
49
-
50
-
51
-
 52
52 -
 53
53 -
 54
54 -
 55
55 -
 56
56 -
 57
57 -
 58
58 -
 59
59 -
 60
60 -
 61
61 -
 62
62 -
 63
63 -
 64
64 -
 65
65 -
 66
66 -
 67
67 -
 68
68 -
 69
69 -
 70
70 -
 71
71 -
 72
72 -
73
-
74
-
75
-
76
-
77
-
78
-
79
-
80
-
81
-
82
-
83
-
84
 |
 |

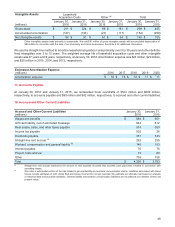
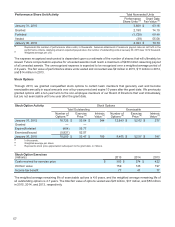
Performance Share Unit Activity Total Nonvested Units
Performance
Share Units (a) Grant Date
Fair Value (b)
January 31, 2015 3,600 $63.16
Granted 2,190 74.19
Forfeited (1,728)60.48
Vested (39)55.58
January 30, 2016 4,023 $70.70
(a) Represents the number of performance share units, in thousands. Assumes attainment of maximum payout rates as set forth in the
performance criteria. Applying actual or expected payout rates, the number of outstanding units at January€30, 2016 was 1,812 thousand.
(b) Weighted average per unit.
The expense recognized each period is dependent upon our estimate of the number of shares that will ultimately be
issued. Future compensation expense for unvested awards could reach a maximum of $230 million assuming payout
of all unvested awards. The unrecognized expense is expected to be recognized over a weighted average period of
2.0 years. The fair value of performance share units vested and converted was $2 million in 2015, $11 million in 2014,
and $14 million in 2013.
Stock Options
Through 2013, we granted nonqualified stock options to certain team members that generally vest and become
exercisable annually in equal amounts over a four-year period and expire 10 years after the grant date. We previously
granted options with a ten-year term to the non-employee members of our Board of Directors that vest immediately,
but are not exercisable until one year after the grant date.
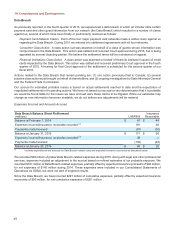
Stock Option Activity Stock Options
Total Outstanding Exercisable
Number of
Options (a) Exercise
Price (b) Intrinsic
Value (c) Number of
Options (a) Exercise
Price (b) Intrinsic
Value (c)
January 31, 2015 16,725 $ 53.04 $ 344 12,843 $ 52.02 $ 277
Granted — —
Expired/forfeited (404) 55.77
Exercised/issued (5,821) 52.07
January 30, 2016 10,500 $ 53.47 $ 199 9,405 $ 52.57 $ 187
(a) In thousands.
(b) Weighted average per share.
(c) Represents stock price appreciation subsequent to the grant date, in millions.
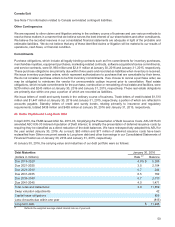
Stock Option Exercises
(millions) 2015 2014 2013
Cash received for exercise price $303 $374 $422
Intrinsic value 159 143 197
Income tax benefit 77 41 77
The weighted average remaining life of exercisable options is 4.6 years, and the weighted average remaining life of
all outstanding options is 4.7 years. The total fair value of options vested was $23 million, $37 million, and $53 million
in 2015, 2014, and 2013, respectively.
57