Target 2015 Annual Report Download - page 42
Download and view the complete annual report
Please find page 42 of the 2015 Target annual report below. You can navigate through the pages in the report by either clicking on the pages listed below, or by using the keyword search tool below to find specific information within the annual report.-
 1
1 -
2
-
3
-
4
-
5
-
6
-
7
-
8
-
9
-
10
-
11
-
12
-
13
-
14
-
15
-
16
-
17
-
18
-
19
-
20
-
21
-
22
-
23
-
24
-
25
-
26
-
27
-
28
-
29
-
30
-
31
-
 32
32 -
 33
33 -
 34
34 -
 35
35 -
 36
36 -
 37
37 -
 38
38 -
 39
39 -
 40
40 -
 41
41 -
 42
42 -
 43
43 -
 44
44 -
 45
45 -
 46
46 -
 47
47 -
 48
48 -
 49
49 -
 50
50 -
 51
51 -
 52
52 -
53
-
54
-
55
-
56
-
57
-
58
-
59
-
60
-
61
-
62
-
63
-
64
-
65
-
66
-
67
-
68
-
69
-
70
-
71
-
72
-
73
-
74
-
75
-
76
-
77
-
78
-
79
-
80
-
81
-
82
-
83
-
84
 |
 |

Consolidated Statements of Cash Flows
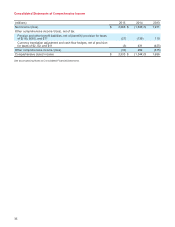
(millions) 2015 2014 2013
Operating activities
Net earnings / (loss) $ 3,363 $ (1,636) $ 1,971
Earnings / (losses) from discontinued operations, net of tax 42 (4,085) (723)
Net earnings from continuing operations 3,321 2,449 2,694
Adjustments to reconcile net earnings to cash provided by operations:
Depreciation and amortization 2,213 2,129 1,996
Share-based compensation expense 115 71 106
Deferred income taxes (322) 7 58
Gain on sale (620) — (391)
Loss on debt extinguishment — 285 445
Noncash (gains) / losses and other, net (12) 40 87
Changes in operating accounts:
Accounts receivable originated at Target — — 157
Proceeds on sale of accounts receivable originated at Target — — 2,703
Inventory (316) (512) (504)
Other assets 227 (115) (79)
Accounts payable and accrued liabilities 534 777 247
Cash provided by operating activities—continuing operations 5,140 5,131 7,519
Cash provided by / (required for) operating activities—discontinued operations 704 (692) (999)
Cash provided by operations 5,844 4,439 6,520
Investing activities
Expenditures for property and equipment (1,438) (1,786) (1,886)
Proceeds from disposal of property and equipment 28 95 70
Proceeds from sale of businesses 1,875 — —
Change in accounts receivable originated at third parties — — 121
Proceeds from sale of accounts receivable originated at third parties — — 3,002
Cash paid for acquisitions, net of cash assumed — (20) (157)
Other investments 24 106 130
Cash provided by / (required for) investing activities—continuing operations 489 (1,605) 1,280
Cash provided by / (required for) investing activities—discontinued operations 19 (321) (1,551)
Cash provided by / (required for) investing activities 508 (1,926) (271)
Financing activities
Change in commercial paper, net — (80) (890)
Additions to long-term debt — 1,993 —
Reductions of long-term debt (85) (2,079) (3,463)
Dividends paid (1,362) (1,205) (1,006)
Repurchase of stock (3,438) — (1,461)
Stock option exercises and related tax benefit 369 373 456
Cash required for financing activities (4,516) (998) (6,364)
Effect of exchange rate changes on cash and cash equivalents — — 26
Net increase / (decrease) in cash and cash equivalents 1,836 1,515 (89)
Cash and cash equivalents at beginning of period (a) 2,210 695 784
Cash and cash equivalents at end of period (b) $ 4,046 $ 2,210 $ 695
Supplemental information
Interest paid, net of capitalized interest $ 604 $ 871 $ 1,043
Income taxes (refunded) / paid (127) 1,251 1,386
Property and equipment acquired through capital lease obligations 126 88 132
(a) Includes cash of our discontinued operations of $25 million and $59 million at February 1, 2014 and February 2, 2013, respectively.
(b) Includes cash of our discontinued operations of $25 million at February 1, 2014.
See accompanying Notes to Consolidated Financial Statements.
37