Target 2015 Annual Report Download - page 69
Download and view the complete annual report
Please find page 69 of the 2015 Target annual report below. You can navigate through the pages in the report by either clicking on the pages listed below, or by using the keyword search tool below to find specific information within the annual report.-
 1
1 -
2
-
3
-
4
-
5
-
6
-
7
-
8
-
9
-
10
-
11
-
12
-
13
-
14
-
15
-
16
-
17
-
18
-
19
-
20
-
21
-
22
-
23
-
24
-
25
-
26
-
27
-
28
-
29
-
30
-
31
-
32
-
33
-
34
-
35
-
36
-
37
-
38
-
39
-
40
-
41
-
42
-
43
-
44
-
45
-
46
-
47
-
48
-
49
-
50
-
51
-
52
-
53
-
54
-
55
-
56
-
57
-
58
-
 59
59 -
 60
60 -
 61
61 -
 62
62 -
 63
63 -
 64
64 -
 65
65 -
 66
66 -
 67
67 -
 68
68 -
 69
69 -
 70
70 -
 71
71 -
 72
72 -
 73
73 -
 74
74 -
 75
75 -
 76
76 -
 77
77 -
 78
78 -
 79
79 -
80
-
81
-
82
-
83
-
84
 |
 |

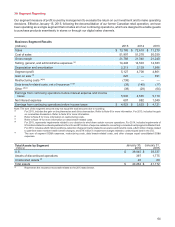
30. Segment Reporting
Our segment measure of profit is used by management to evaluate the return on our investment and to make operating
decisions. Effective January 15, 2015, following the deconsolidation of our former Canadian retail operation, we have
been operating as a single segment that includes all of our continuing operations, which are designed to enable guests
to purchase products seamlessly in stores or through our digital sales channels.
Business€Segment€Results
2015 2014 2013(millions)
Sales $73,785 $72,618 $71,279
Cost of sales 51,997 51,278 50,039
Gross margin 21,788 21,340 21,240
Selling, general, and administrative expenses€(e) 14,448 14,503 14,383
Depreciation and amortization 2,213 2,129 1,996
Segment profit 5,127 4,708 4,861
Gain on sale€(a) 620 — 391
Restructuring costs (b)(e) (138)— —
Data breach-related costs, net of insurance (c)(e) (39)(145)(17)
Other (d)(e) (39)(29)(64)
Earnings from continuing operations before interest expense and income
taxes 5,530 4,535 5,170
Net interest expense 607 882 1,049
Earnings from continuing operations before income taxes $4,923 $3,653 $4,121
Note: The sum of the segment amounts may not equal the total amounts due to rounding.
(a) For 2015, includes the gain on the pharmacies and clinics transaction. Refer to Note 6 for more information. For 2013, includes the gain
on receivables transaction. Refer to Note 9 for more information.
(b) Refer to Note 8 for more information on restructuring costs.
(c) Refer to Note 19 for more information on data breach-related costs.
(d) For 2015, represents impairments related to our decision to wind down certain noncore operations. For 2014, includes impairments of
$16 million related to undeveloped land in the U.S. and $13 million of expense related to converting co-branded card program to MasterCard.
For 2013, includes a $23 million workforce-reduction charge primarily related to severance and benefits costs, a $22 million charge related
to part-time team member health benefit changes, and $19 million in impairment charges related to undeveloped land in the U.S.
(e) The sum of segment SG&A expenses, restructuring costs, data breach-related costs, and other charges equal consolidated SG&A
expenses.
Total Assets by Segment
(millions)
January 30,
2016
January 31,
2015
U.S. $ 39,845 $ 39,337
Assets of discontinued operations 397 1,775
Unallocated assets€(a) 20 60
Total assets $ 40,262 $ 41,172
(a) Represents the insurance receivable related to the 2013 data breach.
64