Toyota 2008 Annual Report Download - page 119
Download and view the complete annual report
Please find page 119 of the 2008 Toyota annual report below. You can navigate through the pages in the report by either clicking on the pages listed below, or by using the keyword search tool below to find specific information within the annual report.-
 1
1 -
2
-
3
-
4
-
5
-
6
-
7
-
8
-
9
-
10
-
11
-
12
-
13
-
14
-
15
-
16
-
17
-
18
-
19
-
20
-
21
-
22
-
23
-
24
-
25
-
26
-
27
-
28
-
29
-
30
-
31
-
32
-
33
-
34
-
35
-
36
-
37
-
38
-
39
-
40
-
41
-
42
-
43
-
44
-
45
-
46
-
47
-
48
-
49
-
50
-
51
-
52
-
53
-
54
-
55
-
56
-
57
-
58
-
59
-
60
-
61
-
62
-
63
-
64
-
65
-
66
-
67
-
68
-
69
-
70
-
71
-
72
-
73
-
74
-
75
-
76
-
77
-
78
-
79
-
80
-
81
-
82
-
83
-
84
-
85
-
86
-
87
-
88
-
89
-
90
-
91
-
92
-
93
-
94
-
95
-
96
-
97
-
98
-
99
-
100
-
101
-
102
-
103
-
104
-
105
-
106
-
107
-
108
-
 109
109 -
 110
110 -
 111
111 -
 112
112 -
 113
113 -
 114
114 -
 115
115 -
 116
116 -
 117
117 -
 118
118 -
 119
119 -
 120
120 -
 121
121 -
 122
122 -
 123
123 -
 124
124 -
 125
125 -
 126
126 -
 127
127 -
 128
128 -
 129
129 -
130
-
131
-
132
-
133
-
134
-
135
-
136
-
137
-
138
 |
 |

117
•Annual Report 2008 • TOYOTA
Performance Messages from the Management &
•Overview •Management •Special Feature •Business Overview •Corporate Information •Financial Section •Investor Information •
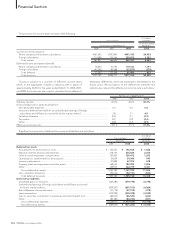
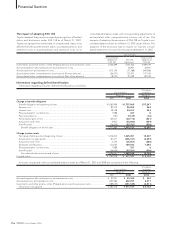
Amounts recognized in accumulated other comprehensive income (loss) as of March 31, 2007 and 2008 are comprised of the following:
U.S. dollars
Yen in millions in millions
March 31, March 31,
2007 2008 2008
Net actuarial loss ........................................................................................................................... ¥ (14,041) ¥(217,138) $(2,167)
Prior service costs .......................................................................................................................... 130,543 125,553 1,253
Net transition obligation............................................................................................................... (9,402) (7,458) (75)
Net amount recognized........................................................................................................ ¥107,100 ¥(99,043) $ (989)
U.S. dollars
Yen in millions in millions
March 31, March 31,
2007 2008 2008
Projected benefit obligation......................................................................................................... ¥529,354 ¥508,505 $5,075
Accumulated benefit obligation ..................................................................................................498,127 467,421 4,665
Fair value of plan assets ................................................................................................................ 95,274 91,723 915
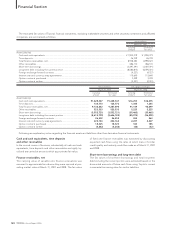
Components of the net periodic pension cost are as follows:
U.S. dollars
Yen in millions in millions
For the year ended
For the years ended March 31, March 31,
2006 2007 2008 2008
Service cost.......................................................................................................... ¥ 64,582 ¥ 80,414 ¥ 96,454 $ 963
Interest cost ......................................................................................................... 40,196 48,128 54,417 543
Expected return on plan assets.......................................................................... (24,278) (38,139) (43,450) (434)
Amortization of prior service costs .................................................................... (17,037) (17,301) (17,162) (171)
Recognized net actuarial loss............................................................................. 19,489 8,299 4,013 40
Amortization of net transition obligation.......................................................... 1,944 1,944 1,944 19
Net periodic pension cost .............................................................................. ¥ 84,896 ¥ 83,345 ¥ 96,216 $ 960
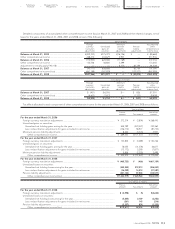
Other changes in plan assets and benefit obligations recognized in other comprehensive income (loss) for the year ended March 31,
2008 are as follows:
U.S. dollars
Yen in millions in millions
For the year ended For the year ended
March 31, March 31,
2008 2008
Net actuarial loss ............................................................................................................................................... ¥(227,439) $(2,270)
Recognized net actuarial loss........................................................................................................................... 4,013 40
Prior service costs.............................................................................................................................................. 7,619 76
Amortization of prior service costs .................................................................................................................. (17,162) (171)
Amortization of net transition obligation ........................................................................................................ 1,944 19
Other .................................................................................................................................................................. 24,882 248
Total recognized in other comprehensive income (loss) ...........................................................................¥(206,143) $(2,058)
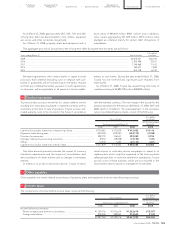
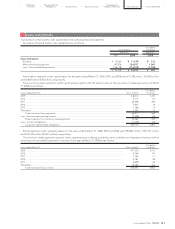
The accumulated benefit obligation for all defined benefit pen-
sion plans was ¥1,552,827 million and ¥1,547,218 million ($15,443
million) at March 31, 2007 and 2008, respectively.
The projected benefit obligation, accumulated benefit obliga-
tion and fair value of plan assets for which the accumulated bene-
fit obligations exceed plan assets are as follows: