Toyota 2008 Annual Report Download - page 126
Download and view the complete annual report
Please find page 126 of the 2008 Toyota annual report below. You can navigate through the pages in the report by either clicking on the pages listed below, or by using the keyword search tool below to find specific information within the annual report.-
 1
1 -
2
-
3
-
4
-
5
-
6
-
7
-
8
-
9
-
10
-
11
-
12
-
13
-
14
-
15
-
16
-
17
-
18
-
19
-
20
-
21
-
22
-
23
-
24
-
25
-
26
-
27
-
28
-
29
-
30
-
31
-
32
-
33
-
34
-
35
-
36
-
37
-
38
-
39
-
40
-
41
-
42
-
43
-
44
-
45
-
46
-
47
-
48
-
49
-
50
-
51
-
52
-
53
-
54
-
55
-
56
-
57
-
58
-
59
-
60
-
61
-
62
-
63
-
64
-
65
-
66
-
67
-
68
-
69
-
70
-
71
-
72
-
73
-
74
-
75
-
76
-
77
-
78
-
79
-
80
-
81
-
82
-
83
-
84
-
85
-
86
-
87
-
88
-
89
-
90
-
91
-
92
-
93
-
94
-
95
-
96
-
97
-
98
-
99
-
100
-
101
-
102
-
103
-
104
-
105
-
106
-
107
-
108
-
109
-
110
-
111
-
112
-
113
-
114
-
115
-
 116
116 -
 117
117 -
 118
118 -
 119
119 -
 120
120 -
 121
121 -
 122
122 -
 123
123 -
 124
124 -
 125
125 -
 126
126 -
 127
127 -
 128
128 -
 129
129 -
 130
130 -
 131
131 -
 132
132 -
 133
133 -
 134
134 -
 135
135 -
 136
136 -
137
-
138
 |
 |
124 TOYOTA •Annual Report 2008 •
Financial Section
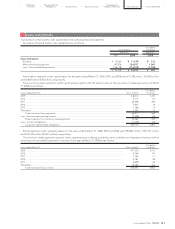
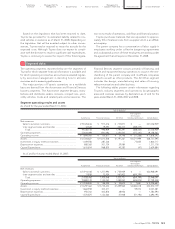
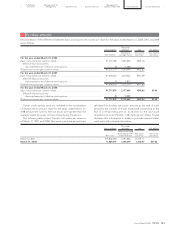
As of and for the year ended March 31, 2008:
Yen in millions
Inter-segment
Elimination/
Automotive Financial Services All Other Unallocated Amount Consolidated
Net revenues
Sales to external customers ............................................. ¥24,160,254 ¥ 1,468,730 ¥ 660,256 ¥ — ¥26,289,240
Inter-segment sales and transfers ................................... 17,052 29,624 686,699 (733,375) —
Total ............................................................................... 24,177,306 1,498,354 1,346,955 (733,375) 26,289,240
Operating expenses ............................................................. 22,005,401 1,411,860 1,313,875 (712,271) 24,018,865
Operating income................................................................. ¥2,171,905 ¥ 86,494 ¥ 33,080 ¥ (21,104) ¥ 2,270,375
Assets..................................................................................... ¥13,593,025 ¥13,942,372 ¥1,273,560 ¥3,649,363 ¥32,458,320
Investment in equity method investees .............................. 1,777,956 235,166 — 52,656 2,065,778
Depreciation expenses......................................................... 1,050,541 409,725 30,869 — 1,491,135
Capital expenditure.............................................................. 1,546,524 1,149,842 56,439 7,170 2,759,975
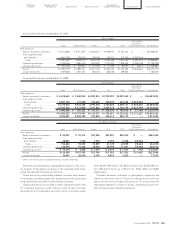
U.S. dollars in millions
Inter-segment
Elimination/
Automotive Financial Services All Other Unallocated Amount Consolidated
Net revenues
Sales to external customers ............................................. $241,144 $ 14,660 $ 6,590 $ — $262,394
Inter-segment sales and transfers ................................... 171 295 6,854 (7,320) —
Total ............................................................................... 241,315 14,955 13,444 (7,320) 262,394
Operating expenses ............................................................. 219,637 14,092 13,114 (7,110) 239,733
Operating income................................................................. $21,678 $ 863 $ 330 $ (210) $ 22,661
Assets..................................................................................... $135,673 $139,159 $12,712 $36,424 $323,968
Investment in equity method investees .............................. 17,746 2,347 — 526 20,619
Depreciation expenses......................................................... 10,485 4,090 308 — 14,883
Capital expenditure.............................................................. 15,436 11,476 564 72 27,548
Geographic Information
As of and for the year ended March 31, 2006:
Yen in millions
Inter-segment
Elimination/
Japan North America Europe Asia Other Unallocated Amount Consolidated
Net revenues
Sales to external customers......... ¥ 7,735,109 ¥7,455,818 ¥2,574,014 ¥1,836,855 ¥1,435,113 ¥ — ¥21,036,909
Inter-segment sales
and transfers................................ 5,376,348 232,124 153,395 205,951 166,623 (6,134,441) —
Total........................................... 13,111,457 7,687,942 2,727,409 2,042,806 1,601,736 (6,134,441) 21,036,909
Operating expenses..................... 12,035,567 7,192,304 2,633,462 1,897,260 1,534,546 (6,134,572) 19,158,567
Operating income ........................ ¥ 1,075,890 ¥ 495,638 ¥ 93,947 ¥ 145,546 ¥ 67,190 ¥ 131 ¥ 1,878,342
Assets............................................. ¥12,177,125 ¥9,199,818 ¥2,471,258 ¥1,255,350 ¥1,299,072 ¥ 2,328,972 ¥28,731,595
Long-lived assets .......................... 3,347,195 2,403,211 473,274 347,892 253,429 — 6,825,001