Toyota 2008 Annual Report Download - page 80
Download and view the complete annual report
Please find page 80 of the 2008 Toyota annual report below. You can navigate through the pages in the report by either clicking on the pages listed below, or by using the keyword search tool below to find specific information within the annual report.-
 1
1 -
2
-
3
-
4
-
5
-
6
-
7
-
8
-
9
-
10
-
11
-
12
-
13
-
14
-
15
-
16
-
17
-
18
-
19
-
20
-
21
-
22
-
23
-
24
-
25
-
26
-
27
-
28
-
29
-
30
-
31
-
32
-
33
-
34
-
35
-
36
-
37
-
38
-
39
-
40
-
41
-
42
-
43
-
44
-
45
-
46
-
47
-
48
-
49
-
50
-
51
-
52
-
53
-
54
-
55
-
56
-
57
-
58
-
59
-
60
-
61
-
62
-
63
-
64
-
65
-
66
-
67
-
68
-
69
-
 70
70 -
 71
71 -
 72
72 -
 73
73 -
 74
74 -
 75
75 -
 76
76 -
 77
77 -
 78
78 -
 79
79 -
 80
80 -
 81
81 -
 82
82 -
 83
83 -
 84
84 -
 85
85 -
 86
86 -
 87
87 -
 88
88 -
 89
89 -
 90
90 -
91
-
92
-
93
-
94
-
95
-
96
-
97
-
98
-
99
-
100
-
101
-
102
-
103
-
104
-
105
-
106
-
107
-
108
-
109
-
110
-
111
-
112
-
113
-
114
-
115
-
116
-
117
-
118
-
119
-
120
-
121
-
122
-
123
-
124
-
125
-
126
-
127
-
128
-
129
-
130
-
131
-
132
-
133
-
134
-
135
-
136
-
137
-
138
 |
 |

78 TOYOTA •Annual Report 2008 •
Financial Section
• Automotive Operations Segment
Net revenues from Toyota’s automotive operations segment,
which constitute the largest percentage of Toyota’s net rev-
enues, increased during fiscal 2008 by ¥2,249.3 billion, or 10.3%
compared with the prior year to ¥24,177.3 billion. The increase
resulted primarily from the approximate ¥1,600 billion impact
attributed to the vehicle unit sales growth and changes in sales
mix, the ¥277.5 billion impact of fluctuations in foreign currency
translation rates during fiscal 2008, and the impact of increased
parts sales. Eliminating the difference in the Japanese yen value
used for translation purposes, automotive operations segment
net revenues would have been approximately ¥23,899.8 billion
during fiscal 2008, a 9.0% increase compared to the prior year.
In fiscal 2008, net revenues in Japan were favorably impacted
primarily by vehicle unit sales growth in the export markets,
which was partially offset by changes in sales mix compared to
fiscal 2007. Net revenues in North America were favorably
impacted primarily by vehicle unit sales growth partially offset
by fluctuations in foreign currency translation rates during fiscal
2008. Net revenues in Europe and Asia were favorably impacted
primarily by vehicle unit sales growth and fluctuations in foreign
currency translation rates during fiscal 2008. Net revenues in
Other were favorably impacted primarily by vehicle unit sales
growth.
• Financial Services Operations Segment
Net revenues in fiscal 2008 for Toyota’s financial services opera-
tions increased by ¥197.8 billion or 15.2% compared to the prior
year to ¥1,498.3 billion. This increase resulted primarily from the
impact of a higher volume of financings mainly in North
America, partially offset by the impact of fluctuations in foreign
currency translation rates during fiscal 2008. Eliminating the dif-
ference in the Japanese yen value used for translation purpos-
es, financial services operations net revenues would have been
approximately ¥1,500.5 billion during fiscal 2008, a 15.4%
increase compared with the prior year.
• All Other Operations Segment
Net revenues for Toyota’s other businesses increased by ¥23.2
billion, or 1.8%, to ¥1,346.9 billion during fiscal 2008 compared
with the prior year.
■Operating Costs and Expenses
Operating costs and expenses increased by ¥2,309.5 billion, or
10.6%, to ¥24,018.9 billion during fiscal 2008 compared with the
prior year. The increase resulted primarily from the approximate
¥1,300 billion impact on costs of products attributed to vehicle
unit sales growth and changes in sales mix, the ¥252.1 billion
impact of fluctuations in foreign currency translation rates, the
¥68.1 billion increase in research and development expenses,
increased expenses in expanding business operations and
increased costs corresponding to the increase in parts sales.
These increases were partially offset by the approximate ¥120
billion impact attributed to the net impact of cost reduction
efforts, responding to the rise in prices of production materials
and parts in fiscal 2008.
Continued cost reduction efforts reduced operating costs
and expenses in fiscal 2008 by approximately ¥120 billion, par-
tially offset by increases in the prices of steel, precious metals,
non-ferrous alloys including aluminum, plastic parts and other
production materials and parts, over what would have otherwise
been incurred. These cost reduction efforts relate to ongoing
value engineering and value analysis activities, the use of com-
mon parts that result in a reduction of part types and other
manufacturing initiatives designed to reduce the costs of vehi-
cle production.
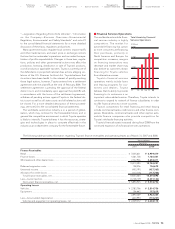
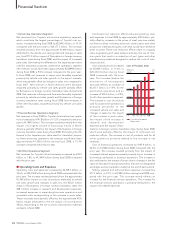
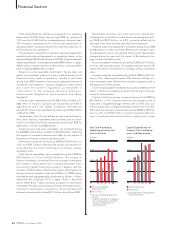
Cost of products sold increased
by ¥2,096.1 billion, or 11.4%, to
¥20,452.4 billion during fiscal
2008 compared with the prior
year. This increase (before the
elimination of intersegment
amounts) reflects an increase of
¥2,107.7 billion, or 11.9%, for the
automotive operations and an
increase of ¥33.4 billion, or 2.9%,
for all other operations segment.
The increase in cost of products
sold for automotive operations is
primarily attributed to the
increased vehicle unit sales and
changes in sales mix, the impact
of the increase in parts sales,
the impact of the increase in
research and development
expenses and the impact of fluc-
tuations in foreign currency translation rates during fiscal 2008,
which were partially offset by the impact of continued cost
reduction efforts. The increase in cost of products sold for all
other operations primarily related to the increase in net
revenues.
Cost of financing operations increased by ¥195.9 billion, or
22.5%, to ¥1,068.0 billion during fiscal 2008 compared with the
prior year. The increase resulted primarily from the impact of
increased interest expenses caused primarily by an increase in
borrowings attributed to business expansion. The increase is
also attributed to the impact of losses due to changes in the fair
value of derivative financial instruments that are not designated
as hedges and are marked-to-market at the end of each period.
Selling, general and administrative expenses increased by
¥17.5 billion, or 0.7%, to ¥2,498.5 billion during fiscal 2008 com-
pared with the prior year. This increase mainly reflects an
increase for the financial services operations. The increase for
the financial services operations is primarily attributed to the
impact of increased expenses.
■
■
’04FY ’05 ’06 ’07 ’08
0
8,000
4,000
12,000
20,000
16,000
0
40
20
60
100
80
(¥ Billion) (%)
% of sales of products
(Right scale)
Cost of Products Sold