Toyota 2008 Annual Report Download - page 85
Download and view the complete annual report
Please find page 85 of the 2008 Toyota annual report below. You can navigate through the pages in the report by either clicking on the pages listed below, or by using the keyword search tool below to find specific information within the annual report.-
 1
1 -
2
-
3
-
4
-
5
-
6
-
7
-
8
-
9
-
10
-
11
-
12
-
13
-
14
-
15
-
16
-
17
-
18
-
19
-
20
-
21
-
22
-
23
-
24
-
25
-
26
-
27
-
28
-
29
-
30
-
31
-
32
-
33
-
34
-
35
-
36
-
37
-
38
-
39
-
40
-
41
-
42
-
43
-
44
-
45
-
46
-
47
-
48
-
49
-
50
-
51
-
52
-
53
-
54
-
55
-
56
-
57
-
58
-
59
-
60
-
61
-
62
-
63
-
64
-
65
-
66
-
67
-
68
-
69
-
70
-
71
-
72
-
73
-
74
-
 75
75 -
 76
76 -
 77
77 -
 78
78 -
 79
79 -
 80
80 -
 81
81 -
 82
82 -
 83
83 -
 84
84 -
 85
85 -
 86
86 -
 87
87 -
 88
88 -
 89
89 -
 90
90 -
 91
91 -
 92
92 -
 93
93 -
 94
94 -
 95
95 -
96
-
97
-
98
-
99
-
100
-
101
-
102
-
103
-
104
-
105
-
106
-
107
-
108
-
109
-
110
-
111
-
112
-
113
-
114
-
115
-
116
-
117
-
118
-
119
-
120
-
121
-
122
-
123
-
124
-
125
-
126
-
127
-
128
-
129
-
130
-
131
-
132
-
133
-
134
-
135
-
136
-
137
-
138
 |
 |

83
•Annual Report 2008 • TOYOTA
Performance Messages from the Management &
•Overview •Management •Special Feature •Business Overview •Corporate Information •Financial Section •Investor Information •
■
■
■
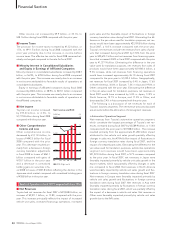
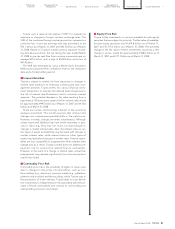
■Net Income
Toyota’s net income increased by ¥271.9 billion, or 19.8%, to
¥1,644.0 billion during fiscal 2007 compared with the prior year.
■Other Comprehensive Income and Loss
Other comprehensive income decreased by ¥344.9 billion, or
66.6%, to ¥173.0 billion for fiscal 2007 compared with the prior
year. This decrease resulted primarily from a decrease in unreal-
ized holding gains on securities during fiscal 2007 of ¥38.8 bil-
lion compared with unrealized holding gains of ¥244.6 billion in
the prior year reflecting an incremental improvement in the
Japanese stock market during fiscal 2006 and a decrease in for-
eign currency translation adjustment gains of ¥130.7 billion in fis-
cal 2007 compared with gains of ¥268.4 billion in the prior year.
Toyota expects that overall steady growth of the world econo-
my will continue driven by resource-rich countries and emerg-
ing countries in fiscal 2009, despite factors such as concerns
about the U.S. economic trend, fluctuations in exchange rates
and the stock market, and energy and raw material prices trend.
Toyota expects that the global automotive markets will remain
at the same level as fiscal 2008. Toyota, for purposes of this dis-
cussion, is assuming an average exchange rate of ¥100 to the
U.S. dollar and ¥155 to the euro. With the foregoing external
factors in mind, Toyota expects that net revenues for fiscal 2009
will decrease compared with fiscal 2008 as a result of the
assumed exchange rates of a stronger Japanese yen against
the U.S. dollar and the euro partially offset by expected
increase in vehicle unit sales. A factor increasing operating
income is the sales efforts expected to increase vehicle unit
sales. On the other hand, factors decreasing operating income
such as the assumed exchange rates of a stronger Japanese
yen against the U.S. dollar and the euro and the anticipated
increase in depreciation expense are expected to exceed the
impact of factors increasing operating income. The effects of
cost reduction efforts are expected to be offset by increases in
the prices of raw materials. As a result, Toyota expects that
operating income will decrease in fiscal 2009 compared with fis-
cal 2008. Also, Toyota expects income before income taxes,
minority interest and equity in earnings of affiliated companies
and net income will decrease in fiscal 2009. Exchange rate
fluctuations can also materially affect Toyota’s operating results.
In particular, a strengthening of the Japanese yen against the
U.S. dollar can have a material adverse effect on Toyota’s
operating results. Please see “Operating and Financial Review
and Prospects—Operating Results—Overview—Currency
Fluctuations.”
The foregoing statements are forward-looking statements
based upon Toyota’s management’s assumptions and beliefs
regarding exchange rates, market demand for Toyota’s prod-
ucts, economic conditions and others. Please see “Cautionary
Statement with Respect to Forward-Looking Statements”.
Toyota’s actual results of operations could vary significantly
from those described above as a result of unanticipated
changes in the factors described above or other factors, includ-
ing those described in “Risk Factors”.
Historically, Toyota has funded its capital expenditures and
research and development activities primarily through cash
generated by operations.
Toyota expects to sufficiently fund its capital expenditures
and research and development activities in fiscal 2009 primarily
through cash and cash equivalents on hand and increases in
cash and cash equivalents from operating activities. See
“Information on the Company—Business Overview—Capital
Expenditures and Divestitures” for information regarding
Toyota’s material capital expenditures and divestitures for fiscal
2006, 2007 and 2008 and information concerning Toyota’s prin-
cipal capital expenditures and divestitures currently in progress.
Toyota funds its financing programs for customers and deal-
ers, including loans and leasing programs, from both operating
cash flows and borrowings by its finance subsidiaries. Toyota
seeks to expand its ability to raise funds locally in markets
throughout the world by expanding its network of finance
subsidiaries.
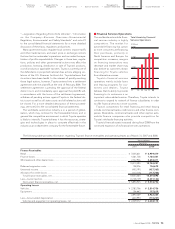
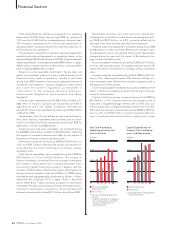
Net cash provided by operating activities was ¥2,981.6 billion
for fiscal 2008, compared with ¥3,238.1 billion for the prior year.
The decrease in net cash provided by operating activities result-
ed primarily from the increase in cash payments of cost of prod-
ucts sold within the automotive and other operations and the
increase in cash payments for income taxes, which was partially
offset by an increase in cash collection received from the sale of
products within the automotive and other operations.
Net cash used in investing activities was ¥3,874.8 billion for
fiscal 2008, compared with ¥3,814.3 billion for the prior year.
The increase in net cash used in investing activities resulted
primarily from the increase in additions to finance receivables,
the increase in purchases of marketable securities and security
investments and the increase in additions to fixed assets, which
was partially offset by an increase in the collection of finance
receivables.
Net cash provided by financing activities was ¥706.1 billion
for fiscal 2008, compared with ¥881.7 billion for the prior year.
The decrease in net cash provided by financing activities result-
ed primarily from an increase in repayments of long-term debt
which was partially offset by increase in proceeds from issuance
of long-term debt.
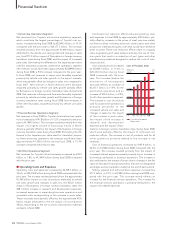
Total capital expenditures for property, plant and equipment,
excluding vehicles and equipment on operating leases, were
¥1,480.5 billion during fiscal 2008, an increase of 3.8% over the
¥1,425.8 billion in total capital expenditures for the prior year.
The increase in capital expenditures resulted primarily from the
impact of higher investments in subsidiaries located in Japan
and North America.
Liquidity and Capital Resources
Outlook