Toyota 2008 Annual Report Download - page 37
Download and view the complete annual report
Please find page 37 of the 2008 Toyota annual report below. You can navigate through the pages in the report by either clicking on the pages listed below, or by using the keyword search tool below to find specific information within the annual report.-
 1
1 -
2
-
3
-
4
-
5
-
6
-
7
-
8
-
9
-
10
-
11
-
12
-
13
-
14
-
15
-
16
-
17
-
18
-
19
-
20
-
21
-
22
-
23
-
24
-
25
-
26
-
 27
27 -
 28
28 -
 29
29 -
 30
30 -
 31
31 -
 32
32 -
 33
33 -
 34
34 -
 35
35 -
 36
36 -
 37
37 -
 38
38 -
 39
39 -
 40
40 -
 41
41 -
 42
42 -
 43
43 -
 44
44 -
 45
45 -
 46
46 -
 47
47 -
48
-
49
-
50
-
51
-
52
-
53
-
54
-
55
-
56
-
57
-
58
-
59
-
60
-
61
-
62
-
63
-
64
-
65
-
66
-
67
-
68
-
69
-
70
-
71
-
72
-
73
-
74
-
75
-
76
-
77
-
78
-
79
-
80
-
81
-
82
-
83
-
84
-
85
-
86
-
87
-
88
-
89
-
90
-
91
-
92
-
93
-
94
-
95
-
96
-
97
-
98
-
99
-
100
-
101
-
102
-
103
-
104
-
105
-
106
-
107
-
108
-
109
-
110
-
111
-
112
-
113
-
114
-
115
-
116
-
117
-
118
-
119
-
120
-
121
-
122
-
123
-
124
-
125
-
126
-
127
-
128
-
129
-
130
-
131
-
132
-
133
-
134
-
135
-
136
-
137
-
138
 |
 |
35
•Annual Report 2008 • TOYOTA
Performance Messages from the Management &
•Overview •Management •Special Feature •Business Overview •Corporate Information •Financial Section •Investor Information •
’04 ’05 ’06 ’07’08
0
4,000
8,000
16,000
12,000
0
4
8
16
12
(¥ Billion) (%)
FY
Operating income margin
(Right scale)
’04 ’05 ’06 ’07’08
0
4
8
16
12
0
4,000
8,000
16,000
12,000
(¥ Billion) (%)
FY
Operating income margin
(Right scale)
’04 ’05 ’06 ’07’08
0
4
8
16
12
0
4,000
8,000
16,000
12,000
(¥ Billion) (%)
FY
Operating income margin
(Right scale)
’04 ’05 ’06 ’07’08
0
4
8
16
12
0
4,000
8,000
16,000
12,000
(¥ Billion) (%)
FY
Operating income margin
(Right scale)
’04 ’05 ’06 ’07’08
0
4
8
16
12
0
4,000
8,000
16,000
12,000
(¥ Billion) (%)
FY
Operating income margin
(Right scale)
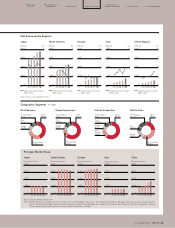
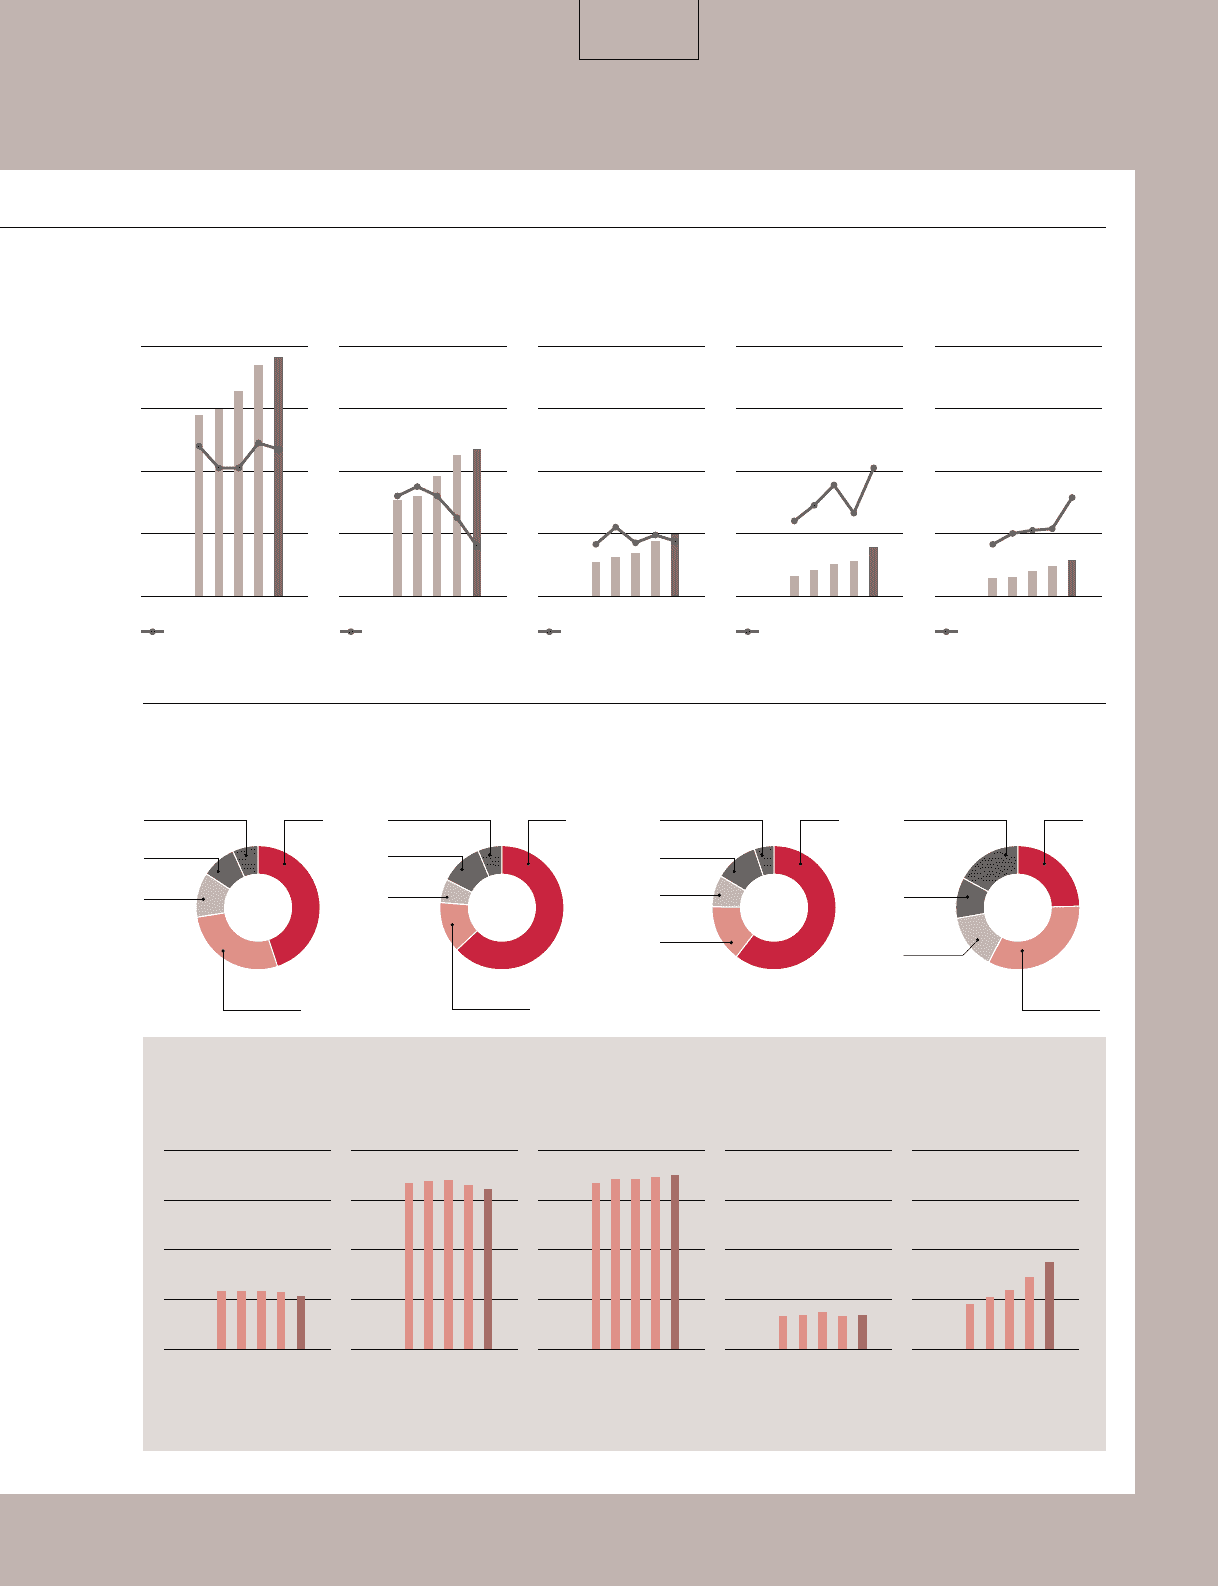
Net Revenues
Japan North America Europe Asia Other Regions
’03 ’04 ’05 ’06’07
0
5,000
10,000
20,000
15,000
(Thousands of units)
CY
Japan
’03 ’04 ’05 ’06’07
0
5,000
10,000
20,000
15,000
(Thousands of units)
CY
United States
’03 ’04 ’05 ’06’07
0
5,000
10,000
20,000
15,000
(Thousands of units)
CY
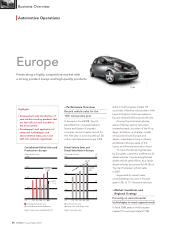
Europe
’03 ’04 ’05 ’06’07
0
5,000
10,000
20,000
15,000
(Thousands of units)
CY
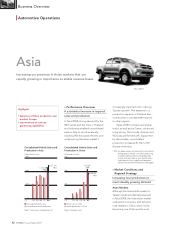
Asia
’03 ’04 ’05 ’06’07
0
5,000
10,000
20,000
15,000
(Thousands of units)
CY
China
North America
27.6%
Japan
44.9%
Other Regions
6.7%
Asia
9.1%
Europe
11.7%
Operating Income
North America
13.3%
Japan
63.0%
Other Regions
6.3%
Asia
11.2%
Europe
6.2%
Vehicle Production
Japan
60.4%
Other Regions
5.2%
Asia
11.3%
Europe
8.3%
North
America
14.8%
Vehicle Sales
North America
33.2%
Japan
24.6%
Other Regions
17.1%
Asia
10.7%
Europe
14.4%
Net Revenues by Regions
Geographic Segment (FY 2008)
Principal Market Data
Source: Toyota Motor Corporation
Note: Market definitions—Europe: Germany, France, the United Kingdom, Italy, Spain, the Netherlands, Belgium, Portugal, Denmark, Greece, Ireland, Sweden,
Austria, Finland, Switzerland, Norway, Poland, Hungary, and the Czech Republic; Asia: Indonesia, Thailand, the Philippines, Malaysia, Singapore, Vietnam,
Taiwan, South Korea, and Brunei Darussalam; Japan: minivehicles included.
Note: Fiscal years ended March 31