Toyota 2008 Annual Report Download - page 94
Download and view the complete annual report
Please find page 94 of the 2008 Toyota annual report below. You can navigate through the pages in the report by either clicking on the pages listed below, or by using the keyword search tool below to find specific information within the annual report.-
 1
1 -
2
-
3
-
4
-
5
-
6
-
7
-
8
-
9
-
10
-
11
-
12
-
13
-
14
-
15
-
16
-
17
-
18
-
19
-
20
-
21
-
22
-
23
-
24
-
25
-
26
-
27
-
28
-
29
-
30
-
31
-
32
-
33
-
34
-
35
-
36
-
37
-
38
-
39
-
40
-
41
-
42
-
43
-
44
-
45
-
46
-
47
-
48
-
49
-
50
-
51
-
52
-
53
-
54
-
55
-
56
-
57
-
58
-
59
-
60
-
61
-
62
-
63
-
64
-
65
-
66
-
67
-
68
-
69
-
70
-
71
-
72
-
73
-
74
-
75
-
76
-
77
-
78
-
79
-
80
-
81
-
82
-
83
-
 84
84 -
 85
85 -
 86
86 -
 87
87 -
 88
88 -
 89
89 -
 90
90 -
 91
91 -
 92
92 -
 93
93 -
 94
94 -
 95
95 -
 96
96 -
 97
97 -
 98
98 -
 99
99 -
 100
100 -
 101
101 -
 102
102 -
 103
103 -
 104
104 -
105
-
106
-
107
-
108
-
109
-
110
-
111
-
112
-
113
-
114
-
115
-
116
-
117
-
118
-
119
-
120
-
121
-
122
-
123
-
124
-
125
-
126
-
127
-
128
-
129
-
130
-
131
-
132
-
133
-
134
-
135
-
136
-
137
-
138
 |
 |

92 TOYOTA •Annual Report 2008 •
Financial Section
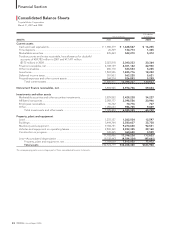
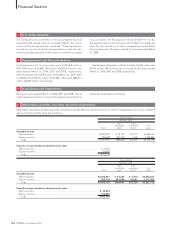
Consolidated Balance Sheets
Toyota Motor Corporation
March 31, 2007 and 2008
U.S. dollars
Yen in millions in millions
ASSETS 2007 2008 2008
Current assets
Cash and cash equivalents............................................................................... ¥ 1,900,379 ¥1,628,547 $ 16,255
Time deposits.................................................................................................... 26,709 134,773 1,345
Marketable securities ....................................................................................... 435,463 542,210 5,412
Trade accounts and notes receivable, less allowance for doubtful
accounts of ¥24,782 million in 2007 and ¥17,471 million
($175 million) in 2008 ...................................................................................... 2,023,818 2,040,233 20,364
Finance receivables, net................................................................................... 4,108,139 4,301,142 42,930
Other receivables.............................................................................................. 486,170 523,533 5,225
Inventories ......................................................................................................... 1,803,956 1,825,716 18,222
Deferred income taxes..................................................................................... 551,503 563,220 5,621
Prepaid expenses and other current assets ................................................... 544,274 526,853 5,259
Total current assets................................................................................... 11,880,411 12,086,227 120,633
Noncurrent finance receivables, net................................................................ 5,894,925 5,974,756 59,634
Investments and other assets
Marketable securities and other securities investments................................ 3,829,852 3,429,238 34,227
Affiliated companies......................................................................................... 2,058,177 2,098,556 20,946
Employees receivables..................................................................................... 96,742 70,776 707
Other.................................................................................................................. 1,050,633986,765 9,849
Total investments and other assets......................................................... 7,035,404 6,585,335 65,729
Property, plant and equipment
Land ................................................................................................................... 1,233,1371,262,034 12,597
Buildings............................................................................................................ 3,444,764 3,580,607 35,738
Machinery and equipment............................................................................... 9,184,751 9,270,650 92,531
Vehicles and equipment on operating leases................................................ 2,890,369 2,922,325 29,168
Construction in progress.................................................................................. 349,465 360,620 3,599
17,102,486 17,396,236 173,633
Less—Accumulated depreciation ................................................................... (9,338,447) (9,584,234) (95,661)
Property, plant and equipment, net........................................................ 7,764,039 7,812,002 77,972
Total assets............................................................................................... ¥32,574,779 ¥32,458,320 $323,968
The accompanying notes are an integral part of these consolidated financial statements.