Toyota 2008 Annual Report Download - page 19
Download and view the complete annual report
Please find page 19 of the 2008 Toyota annual report below. You can navigate through the pages in the report by either clicking on the pages listed below, or by using the keyword search tool below to find specific information within the annual report.-
 1
1 -
2
-
3
-
4
-
5
-
6
-
7
-
8
-
 9
9 -
 10
10 -
 11
11 -
 12
12 -
 13
13 -
 14
14 -
 15
15 -
 16
16 -
 17
17 -
 18
18 -
 19
19 -
 20
20 -
 21
21 -
 22
22 -
 23
23 -
 24
24 -
 25
25 -
 26
26 -
 27
27 -
 28
28 -
 29
29 -
30
-
31
-
32
-
33
-
34
-
35
-
36
-
37
-
38
-
39
-
40
-
41
-
42
-
43
-
44
-
45
-
46
-
47
-
48
-
49
-
50
-
51
-
52
-
53
-
54
-
55
-
56
-
57
-
58
-
59
-
60
-
61
-
62
-
63
-
64
-
65
-
66
-
67
-
68
-
69
-
70
-
71
-
72
-
73
-
74
-
75
-
76
-
77
-
78
-
79
-
80
-
81
-
82
-
83
-
84
-
85
-
86
-
87
-
88
-
89
-
90
-
91
-
92
-
93
-
94
-
95
-
96
-
97
-
98
-
99
-
100
-
101
-
102
-
103
-
104
-
105
-
106
-
107
-
108
-
109
-
110
-
111
-
112
-
113
-
114
-
115
-
116
-
117
-
118
-
119
-
120
-
121
-
122
-
123
-
124
-
125
-
126
-
127
-
128
-
129
-
130
-
131
-
132
-
133
-
134
-
135
-
136
-
137
-
138
 |
 |

17
•Annual Report 2008 • TOYOTA
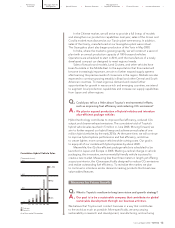
2. Performance by Segment
In Japan, net revenues increased 3.4%, to ¥15,315.8 billion, while operating
income decreased 1.2%, to ¥1,440.3 billion, which maintained earnings at the
same high level recorded in the previous fiscal year. As a result of brisk
demand in resource-rich and emerging countries in fiscal 2008, we increased
export volumes through our flexible domestic production system.
In North America, net revenues increased 4.4%, to ¥9,423.2 billion, while
operating income decreased 32.1%, to ¥305.3 billion. Amidst lower sales in
the U.S. automotive market year on year, Toyota’s market share in the United
States reached a record high of 16.3%. At the same time, the rapid decline in
interest rates in the United States during fiscal 2008 resulted in an increase
in valuation losses on interest rate swaps stated at fair market value by ¥66.7
billion, to ¥91.4 billion, at sales finance subsidiaries. Excluding the influence
of these valuation losses on interest rate swaps, Toyota’s operating income in
North America remained high, at approximately ¥400.0 billion.
In Europe, Toyota recorded a rise in net revenues of 12.7%, to ¥3,993.4
billion, and a 3.0% increase in operating income, to ¥141.5 billion. In the
rapidly growing Russian and Eastern European markets, sales of Camry and
Avensis were brisk and contributed to profit growth.
In Asia, net revenues rose 40.2%, to ¥3,120.9 billion, and operating income
increased 2.2 times over the previous fiscal year, to ¥256.4 billion. Strong sales
of IMV* vehicles and Yaris in Indonesia and Thailand, as well as increased
export of IMV vehicles to areas outside of Asia—enabled by the enhanced
production capacity in Thailand—all contributed to the expansion of profit.
Central and South America, Oceania, and Africa also posted a large
increase in earnings, with increases of 19.3% in net revenues, to ¥2,294.1
billion, and 72.4% in operating income, to ¥143.9 billion. Models adapted
to local tastes, such as the Corolla in Brazil, IMVs in Argentina, and the Camry
in Australia, helped boost vehicle sales across all markets.
In the financial services segment, net revenues rose 15.2%, to ¥1,498.3
billion, while operating income fell 45.4%, to ¥86.5 billion, mainly due to an
increase in valuation losses on interest rate swaps stated at fair value by ¥48.1
billion, to ¥68.0 billion, at sales finance subsidiaries. In addition, the credit
crunch in the U.S. market that caused the loan loss ratio to soar in the latter
half of 2007 is another principal cause of the decline in the financial services
segment income. Toyota has maintained a conservative credit policy.
Furthermore, we have strengthened our credit control and debt collection
practices since last autumn. In addition, the increase in outstanding loan
balance due to the increase in vehicle sales and the improvement in lending
margins are contributing to financial services segment earnings.
Equity in earnings of affiliated companies rose 28.9%, to ¥270.1 billion,
primarily due to the strong performance by our joint ventures in China and
domestic Group companies. Especially, ongoing efforts by our Chinese joint
ventures to steadily develop their production and sales foundation, in
response to brisk local demand, are contributing greatly to profit.
For fiscal 2009, ending March 31, 2009, we are forecasting vehicle sales of 9.06
million units, net revenues of ¥25,000.0 billion, operating income of ¥1,600.0
billion, and net income of ¥1,250.0 billion on a consolidated basis. This forecast
assumes average exchange rates through the fiscal year of ¥100 per US$1 and
Consolidated Results Outlook for Fiscal 2009
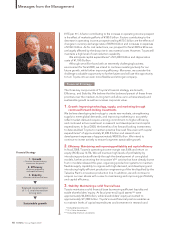
Performance Messages from the Management &
•Overview •Management •Special Feature •Business Overview •Corporate Information •Financial Section •Investor Information •
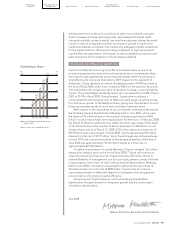
Net Revenues by Region
North America
27.6%
Japan
44.9%
Other Regions
6.7%
Asia
9.1%
Europe
11.7%
FY 2008
Operating Income by Region
FY 2008
North America
13.3%
Japan
63.0%
Other Regions
6.3%
Asia
11.2%
Europe
6.2%
* IMV: An abbreviation for Innovative International Multipurpose Vehicle, which refers to sport-utility
vehicles (SUVs), pickup trucks, and other multipurpose vehicles that Toyota develops and
produces overseas for markets worldwide.