Toyota 2008 Annual Report Download - page 131
Download and view the complete annual report
Please find page 131 of the 2008 Toyota annual report below. You can navigate through the pages in the report by either clicking on the pages listed below, or by using the keyword search tool below to find specific information within the annual report.-
 1
1 -
2
-
3
-
4
-
5
-
6
-
7
-
8
-
9
-
10
-
11
-
12
-
13
-
14
-
15
-
16
-
17
-
18
-
19
-
20
-
21
-
22
-
23
-
24
-
25
-
26
-
27
-
28
-
29
-
30
-
31
-
32
-
33
-
34
-
35
-
36
-
37
-
38
-
39
-
40
-
41
-
42
-
43
-
44
-
45
-
46
-
47
-
48
-
49
-
50
-
51
-
52
-
53
-
54
-
55
-
56
-
57
-
58
-
59
-
60
-
61
-
62
-
63
-
64
-
65
-
66
-
67
-
68
-
69
-
70
-
71
-
72
-
73
-
74
-
75
-
76
-
77
-
78
-
79
-
80
-
81
-
82
-
83
-
84
-
85
-
86
-
87
-
88
-
89
-
90
-
91
-
92
-
93
-
94
-
95
-
96
-
97
-
98
-
99
-
100
-
101
-
102
-
103
-
104
-
105
-
106
-
107
-
108
-
109
-
110
-
111
-
112
-
113
-
114
-
115
-
116
-
117
-
118
-
119
-
120
-
 121
121 -
 122
122 -
 123
123 -
 124
124 -
 125
125 -
 126
126 -
 127
127 -
 128
128 -
 129
129 -
 130
130 -
 131
131 -
 132
132 -
 133
133 -
 134
134 -
 135
135 -
 136
136 -
 137
137 -
 138
138
 |
 |

129
•Annual Report 2008 • TOYOTA
Performance Messages from the Management &
•Overview •Management •Special Feature •Business Overview •Corporate Information •Financial Section •Investor Information •
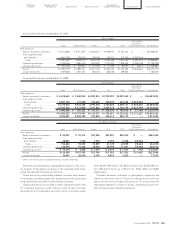
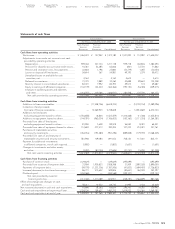
Statements of cash flows
Yen in millions Yen in millions
For the year ended March 31, 2006 For the year ended March 31, 2007
Non-Financial Financial Non-Financial Financial
Services Services Services Services
Businesses Businesses Consolidated Businesses Businesses Consolidated
Cash flows from operating activities
Net income....................................................................... ¥ 1,264,223 ¥ 107,952 ¥ 1,372,180 ¥ 1,531,093 ¥ 112,987 ¥ 1,644,032
Adjustments to reconcile net income to net cash
provided by operating activities
Depreciation................................................................. 909,444 301,734 1,211,178 979,718 402,876 1,382,594
Provision for doubtful accounts and credit losses .... 10,361 52,285 62,646 (841) 72,703 71,862
Pension and severance costs, less payments............ 22,664 1,196 23,860 (33,319) 1,265 (32,054)
Losses on disposal of fixed assets.............................. 54,614 367 54,981 49,193 1,279 50,472
Unrealized losses on available-for-sale
securities, net ............................................................. 4,163 — 4,163 4,614 — 4,614
Deferred income taxes................................................ 31,370 1,889 33,262 42,698 89,643 132,308
Minority interest in consolidated subsidiaries........... 82,401 1,992 84,393 49,513 174 49,687
Equity in earnings of affiliated companies ................ (142,139) (22,227) (164,366) (193,130) (16,385) (209,515)
Changes in operating assets and liabilities,
and other .................................................................... (214,507) 138,766 (166,817) 182,548 125,700 144,173
Net cash provided by operating activities............. 2,022,594 583,954 2,515,480 2,612,087 790,242 3,238,173
Cash flows from investing activities
Additions to finance receivables .................................... — (11,548,746) (6,618,335) — (14,192,154) (7,489,096)
Collection of and proceeds
from sale of finance receivables ................................... — 10,565,903 5,738,608 — 12,814,669 6,274,744
Additions to fixed assets
excluding equipment leased to others........................ (1,516,658) (6,801) (1,523,459) (1,414,468) (11,346) (1,425,814)
Additions to equipment leased to others ..................... (144,391) (962,034) (1,106,425) (153,163) (1,111,218) (1,264,381)
Proceeds from sales of fixed assets
excluding equipment leased to others........................ 81,950 7,628 89,578 56,040 8,381 64,421
Proceeds from sales of equipment leased to others.... 112,692 277,513 390,205 107,270 214,491 321,761
Purchases of marketable securities
and security investments............................................... (764,016) (193,280) (957,296) (889,008) (179,197) (1,068,205)
Proceeds from sales of and maturity of
marketable securities and security investments.......... 561,948 129,084 691,032 708,130 117,041 825,171
Payment for additional investments
in affiliated companies, net of cash acquired.............. (1,802) — (1,802) (1,651) — (1,651)
Changes in investments and other assets,
and other ........................................................................ (3,292) (83,104) (77,606) (21,751) 15,250 (51,328)
Net cash used in investing activities ...................... (1,673,569) (1,813,837) (3,375,500) (1,608,601) (2,324,083) (3,814,378)
Cash flows from financing activities
Purchase of common stock............................................. (129,629) — (129,629) (295,699) — (295,699)
Proceeds from issuance of long-term debt................... 33,904 1,930,823 1,928,788 31,509 2,897,028 2,890,000
Payments of long-term debt........................................... (59,778) (1,233,336) (1,187,506) (41,833) (1,694,407) (1,726,823)
Increase (decrease) in short-term borrowings............... 86,731 513,602 509,826 (83,651) 362,078 353,397
Dividends paid................................................................. (244,568) — (244,568) (339,107) — (339,107)
Net cash provided by (used in)
financing activities ................................................. (313,340) 1,211,089 876,911 (728,781) 1,564,699 881,768
Effect of exchange rate changes on cash
and cash equivalents ......................................................... 58,211 10,532 68,743 21,995 3,434 25,429
Net increase (decrease) in cash and cash equivalents ..... 93,896 (8,262) 85,634 296,700 34,292 330,992
Cash and cash equivalents at beginning of year .............. 1,324,126 159,627 1,483,753 1,418,022 151,365 1,569,387
Cash and cash equivalents at end of year ......................... ¥ 1,418,022 ¥ 151,365 ¥ 1,569,387 ¥ 1,714,722 ¥ 185,657 ¥ 1,900,379