Toyota 2008 Annual Report Download - page 86
Download and view the complete annual report
Please find page 86 of the 2008 Toyota annual report below. You can navigate through the pages in the report by either clicking on the pages listed below, or by using the keyword search tool below to find specific information within the annual report.-
 1
1 -
2
-
3
-
4
-
5
-
6
-
7
-
8
-
9
-
10
-
11
-
12
-
13
-
14
-
15
-
16
-
17
-
18
-
19
-
20
-
21
-
22
-
23
-
24
-
25
-
26
-
27
-
28
-
29
-
30
-
31
-
32
-
33
-
34
-
35
-
36
-
37
-
38
-
39
-
40
-
41
-
42
-
43
-
44
-
45
-
46
-
47
-
48
-
49
-
50
-
51
-
52
-
53
-
54
-
55
-
56
-
57
-
58
-
59
-
60
-
61
-
62
-
63
-
64
-
65
-
66
-
67
-
68
-
69
-
70
-
71
-
72
-
73
-
74
-
75
-
 76
76 -
 77
77 -
 78
78 -
 79
79 -
 80
80 -
 81
81 -
 82
82 -
 83
83 -
 84
84 -
 85
85 -
 86
86 -
 87
87 -
 88
88 -
 89
89 -
 90
90 -
 91
91 -
 92
92 -
 93
93 -
 94
94 -
 95
95 -
 96
96 -
97
-
98
-
99
-
100
-
101
-
102
-
103
-
104
-
105
-
106
-
107
-
108
-
109
-
110
-
111
-
112
-
113
-
114
-
115
-
116
-
117
-
118
-
119
-
120
-
121
-
122
-
123
-
124
-
125
-
126
-
127
-
128
-
129
-
130
-
131
-
132
-
133
-
134
-
135
-
136
-
137
-
138
 |
 |
84 TOYOTA •Annual Report 2008 •
Financial Section
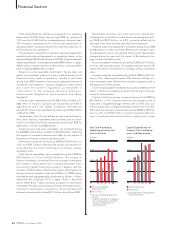
Total expenditures for vehicles and equipment on operating
leases were ¥1,279.4 billion during fiscal 2008, an increase of
1.2% over the ¥1,264.3 billion in expenditures in the prior year.
The increase in expenditures for vehicles and equipment on
operating leases resulted primarily from business expansion in
the financial services operations.
Toyota expects investments in property, plant and equipment,
excluding vehicles and equipment on operating leases, to be
approximately ¥1,400.0 billion during fiscal 2009. Toyota’s expected
capital expenditures include approximately ¥820.0 billion in Japan,
¥320.0 billion in North America, ¥140.0 billion in Europe, ¥60.0
billion in Asia and ¥60.0 billion in Other.
Based on current available information, Toyota does not
expect environmental matters to have a material impact on its
financial position, results of operations, liquidity or cash flows
during fiscal 2009. However, there exists a substantial amount of
uncertainty with respect to Toyota’s obligations under current
and future environment regulations as described in
“Information on the Company—Business Overview—
Governmental Regulations, Environmental and Safety
Standards”.
Cash and cash equivalents were ¥1,628.5 billion at March 31,
2008. Most of Toyota’s cash and cash equivalents are held in
Japanese yen and in U.S. dollars. In addition, time deposits
were ¥134.7 billion and marketable securities were ¥542.2 billion
at March 31, 2008.
Liquid assets, which Toyota defines as cash and cash equiva-
lents, time deposits, marketable debt securities and its invest-
ment in monetary trust funds, decreased during fiscal 2008 by
¥24.3 billion, or 0.5%, to ¥4,480.9 billion.
Trade accounts and notes receivable, net increased during
fiscal 2008 by ¥16.4 billion, or 0.8%, to ¥2,040.2 billion, reflecting
the impact of increased revenues and offset by the impact of
fluctuations in foreign currency translation rates.
Inventories increased during fiscal 2008 by ¥21.8 billion, or
1.2%, to ¥1,825.7 billion, reflecting the impact of increased vol-
umes offset by the impact of fluctuations in foreign currency
translation rates.
Total finance receivables, net increased during fiscal 2008 by
¥272.8 billion, or 2.7%, to ¥10,275.8 billion. The increase in
finance receivables, net resulted from the increase in wholesale,
the increase in other dealer loans including real estate loans
and working capital financing provided to dealers, and the
increase in finance leases offset by the impact of fluctuations in
foreign currency translation rates. As of March 31, 2008, finance
receivables were geographically distributed as follows: in North
America 61.9%, in Europe 13.1%, in Japan 12.6%, in Asia 4.0%
and in Other 8.4%. Toyota maintains programs to sell finance
receivables through special purpose entities and obtained pro-
ceeds from securitization transactions, net of purchased and
retained interests which totaled ¥91.3 billion during fiscal 2008.
Marketable securities and other securities investments,
including those included in current assets, decreased during fis-
cal 2008 by ¥293.9 billion, or 6.9%, primarily reflecting the
decrease in fair value of these securities and investments.
Property, plant and equipment increased during fiscal 2008
by ¥48.0 billion, or 0.6%, primarily reflecting an increase in capi-
tal expenditures which was partially offset by the depreciation
charges during the year and the impact of fluctuations in for-
eign currency translation rates.
Accounts payable increased during fiscal 2008 by ¥1.2 billion,
or 0.1%, reflecting the impact of increased trading volumes off-
set by the impact of fluctuations in foreign currency translation
rates.
Accrued expenses decreased during fiscal 2008 by ¥61.4 bil-
lion, or 3.7%, reflecting the impact of fluctuations in foreign cur-
rency translation rates offset by the increase in expenses due to
the expansion of the business.
Income taxes payable decreased during fiscal 2008 by ¥115.6
billion, or 27.4%, principally as a result of the timing of cash pay-
ments for income taxes.
Toyota’s total borrowings increased during fiscal 2008 by
¥81.0 billion, or 0.7%. Toyota’s short-term borrowings consist of
loans with a weighted-average interest rate of 3.36% and com-
mercial paper with a weighted-average interest rate of 3.76%.
Short-term borrowings increased during fiscal 2008 by ¥55.4 bil-
lion, or 1.6%, to ¥3,552.7 billion. Toyota’s long-term debt con-
sists of unsecured and secured loans, medium-term notes,
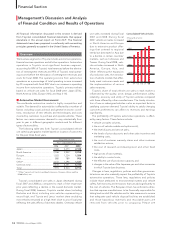
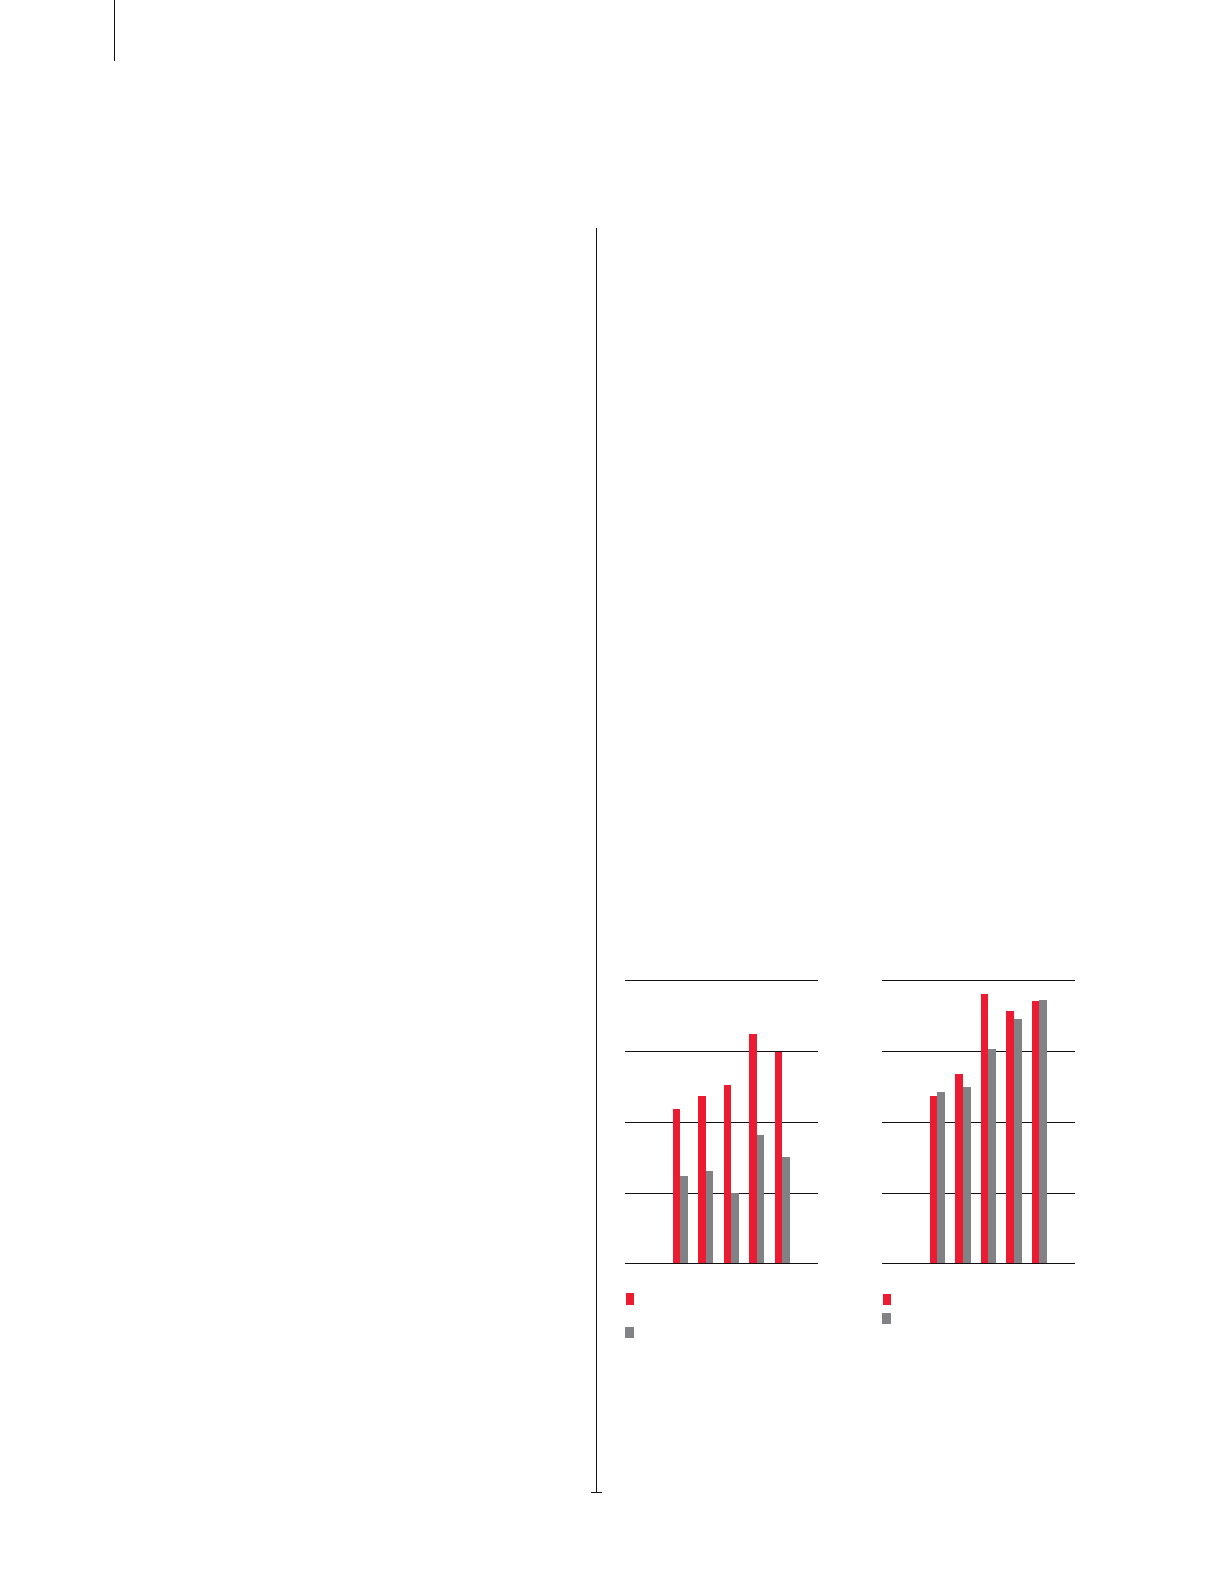
’04FY ’05 ’06 ’07 ’08
800
1,600
400
0
1,200
(¥ Billion)
Capital expenditures
Depreciation
* Excluding vehicles and equipment
on operating leases
Capital Expenditures for
Property, Plant and Equip-
ment* and Depreciation
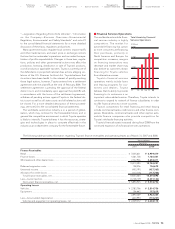
’04FY ’05 ’06 ’07 ’08
2,000
4,000
1,000
0
3,000
(¥ Billion)
Net cash provided by
operating activities
Free cash flow
* (Net cash provided by operating
activities)
– (Capital expenditures for property,
plant and equipment, excluding
vehicles and equipment on
operating leases)
Net Cash Provided by
Operating Activities and
Free Cash Flow*