Toyota 2008 Annual Report Download - page 128
Download and view the complete annual report
Please find page 128 of the 2008 Toyota annual report below. You can navigate through the pages in the report by either clicking on the pages listed below, or by using the keyword search tool below to find specific information within the annual report.-
 1
1 -
2
-
3
-
4
-
5
-
6
-
7
-
8
-
9
-
10
-
11
-
12
-
13
-
14
-
15
-
16
-
17
-
18
-
19
-
20
-
21
-
22
-
23
-
24
-
25
-
26
-
27
-
28
-
29
-
30
-
31
-
32
-
33
-
34
-
35
-
36
-
37
-
38
-
39
-
40
-
41
-
42
-
43
-
44
-
45
-
46
-
47
-
48
-
49
-
50
-
51
-
52
-
53
-
54
-
55
-
56
-
57
-
58
-
59
-
60
-
61
-
62
-
63
-
64
-
65
-
66
-
67
-
68
-
69
-
70
-
71
-
72
-
73
-
74
-
75
-
76
-
77
-
78
-
79
-
80
-
81
-
82
-
83
-
84
-
85
-
86
-
87
-
88
-
89
-
90
-
91
-
92
-
93
-
94
-
95
-
96
-
97
-
98
-
99
-
100
-
101
-
102
-
103
-
104
-
105
-
106
-
107
-
108
-
109
-
110
-
111
-
112
-
113
-
114
-
115
-
116
-
117
-
 118
118 -
 119
119 -
 120
120 -
 121
121 -
 122
122 -
 123
123 -
 124
124 -
 125
125 -
 126
126 -
 127
127 -
 128
128 -
 129
129 -
 130
130 -
 131
131 -
 132
132 -
 133
133 -
 134
134 -
 135
135 -
 136
136 -
 137
137 -
 138
138
 |
 |

126 TOYOTA •Annual Report 2008 •
Financial Section
U.S. dollars
Yen in millions in millions
For the year ended
For the years ended March 31, March 31,
2006 2007 2008 2008
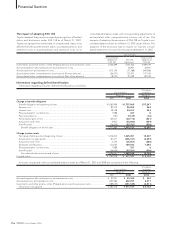
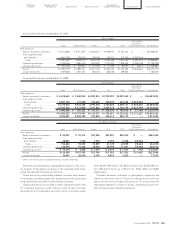
North America ..................................................................................................... ¥7,687,738 ¥9,039,560 ¥9,606,481 $95,883
Europe.................................................................................................................. 2,607,819 3,345,001 3,746,362 37,393
Asia ....................................................................................................................... 2,005,777 2,248,031 2,968,460 29,628
Other .................................................................................................................... 2,721,981 3,168,580 3,831,739 38,245
* “Other” consists of Central and South America, Oceania, Africa and the Middle East, etc.
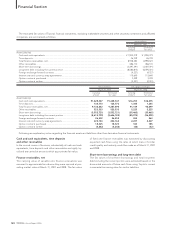
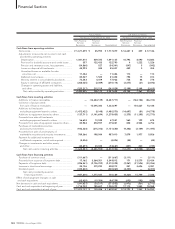
Certain financial statement data on non-financial services and financial services businesses
The financial data below presents separately Toyota’s non-financial services and financial services businesses.
Balance sheets
U.S. dollars
Yen in millions in millions
March 31, March 31,
2007 2008 2008
Non-Financial Services Businesses
Current assets
Cash and cash equivalents .................................................................................................. ¥ 1,714,722 ¥1,473,101 $ 14,703
Marketable securities ...........................................................................................................433,434 526,801 5,258
Trade accounts and notes receivable, less allowance for doubtful accounts ................. 2,044,729 2,077,491 20,736
Inventories............................................................................................................................. 1,803,956 1,825,716 18,222
Prepaid expenses and other current assets ....................................................................... 1,617,554 1,676,263 16,731
Total current assets .......................................................................................................... 7,614,395 7,579,372 75,650
Investments and other assets .................................................................................................. 6,464,204 6,064,286 60,528
Property, plant and equipment............................................................................................... 5,689,383 5,773,370 57,624
Total Non-Financial Services Businesses assets ............................................................ 19,767,982 19,417,028 193,802
Financial Services Businesses
Current assets
Cash and cash equivalents .................................................................................................. 185,657 155,446 1,552
Marketable securities ...........................................................................................................2,029 15,409 154
Finance receivables, net ...................................................................................................... 4,108,139 4,301,142 42,930
Prepaid expenses and other current assets ....................................................................... 766,552 793,434 7,919
Total current assets .......................................................................................................... 5,062,377 5,265,431 52,555
Noncurrent finance receivables, net....................................................................................... 5,894,925 5,974,756 59,634
Investments and other assets .................................................................................................. 703,476 663,553 6,622
Property, plant and equipment............................................................................................... 2,074,656 2,038,632 20,348
Total Financial Services Businesses assets ..................................................................... 13,735,434 13,942,372 139,159
Eliminations............................................................................................................................. (928,637) (901,080) (8,993)
Total assets........................................................................................................................ ¥32,574,779 ¥32,458,320 $323,968
Assets in the non-financial services include unallocated corporate assets.
Overseas Revenues by destination
The following information shows revenues that are attributed to countries based on location of customers, excluding customers in
Japan. In addition to the disclosure requirements under FAS No. 131,
Disclosure about Segments of an Enterprise and Related
Information
(“FAS 131”), Toyota discloses this information in order to provide financial statement users with valuable information.