Toyota 2008 Annual Report Download - page 98
Download and view the complete annual report
Please find page 98 of the 2008 Toyota annual report below. You can navigate through the pages in the report by either clicking on the pages listed below, or by using the keyword search tool below to find specific information within the annual report.-
 1
1 -
2
-
3
-
4
-
5
-
6
-
7
-
8
-
9
-
10
-
11
-
12
-
13
-
14
-
15
-
16
-
17
-
18
-
19
-
20
-
21
-
22
-
23
-
24
-
25
-
26
-
27
-
28
-
29
-
30
-
31
-
32
-
33
-
34
-
35
-
36
-
37
-
38
-
39
-
40
-
41
-
42
-
43
-
44
-
45
-
46
-
47
-
48
-
49
-
50
-
51
-
52
-
53
-
54
-
55
-
56
-
57
-
58
-
59
-
60
-
61
-
62
-
63
-
64
-
65
-
66
-
67
-
68
-
69
-
70
-
71
-
72
-
73
-
74
-
75
-
76
-
77
-
78
-
79
-
80
-
81
-
82
-
83
-
84
-
85
-
86
-
87
-
 88
88 -
 89
89 -
 90
90 -
 91
91 -
 92
92 -
 93
93 -
 94
94 -
 95
95 -
 96
96 -
 97
97 -
 98
98 -
 99
99 -
 100
100 -
 101
101 -
 102
102 -
 103
103 -
 104
104 -
 105
105 -
 106
106 -
 107
107 -
 108
108 -
109
-
110
-
111
-
112
-
113
-
114
-
115
-
116
-
117
-
118
-
119
-
120
-
121
-
122
-
123
-
124
-
125
-
126
-
127
-
128
-
129
-
130
-
131
-
132
-
133
-
134
-
135
-
136
-
137
-
138
 |
 |

96 TOYOTA •Annual Report 2008 •
Financial Section
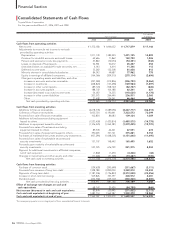
Consolidated Statements of Cash Flows
Toyota Motor Corporation
For the years ended March 31, 2006, 2007 and 2008
U.S. dollars
Yen in millions in millions
2006 2007 2008 2008
Cash flows from operating activities
Net income......................................................................................... ¥ 1,372,180 ¥ 1,644,032 ¥ 1,717,879 $ 17,146
Adjustments to reconcile net income to net cash
provided by operating activities
Depreciation .................................................................................. 1,211,178 1,382,594 1,491,135 14,883
Provision for doubtful accounts and credit losses...................... 62,646 71,862 122,790 1,226
Pension and severance costs, less payments.............................. 23,860 (32,054) (54,341) (542)
Losses on disposal of fixed assets................................................ 54,981 50,472 45,437 454
Unrealized losses on available-for-sale securities, net ............... 4,163 4,614 11,346 113
Deferred income taxes.................................................................. 33,262 132,308 81,458 813
Minority interest in consolidated subsidiaries............................. 84,393 49,687 77,962 778
Equity in earnings of affiliated companies .................................. (164,366) (209,515) (270,114) (2,696)
Changes in operating assets and liabilities, and other
Increase in accounts and notes receivable.............................. (297,598) (212,856) (206,793) (2,064)
Increase in inventories............................................................... (248,823) (133,698) (149,984) (1,497)
Increase in other current assets................................................ (89,723) (108,767) (82,737) (826)
Increase in accounts payable.................................................... 188,702 104,188 62,241 621
Increase (decrease) in accrued income taxes.......................... 54,052 74,255 (118,030) (1,178)
Increase in other current liabilities ........................................... 203,075 264,490 206,911 2,065
Other........................................................................................... 23,498 156,561 46,464 464
Net cash provided by operating activities .......................... 2,515,480 3,238,173 2,981,624 29,760
Cash flows from investing activities
Additions to finance receivables...................................................... (6,618,335) (7,489,096) (8,647,717) (86,313)
Collection of finance receivables ..................................................... 5,635,754 6,190,661 7,223,573 72,099
Proceeds from sale of finance receivables ...................................... 102,854 84,083 109,124 1,089
Additions to fixed assets excluding equipment
leased to others ............................................................................... (1,523,459) (1,425,814) (1,480,570) (14,778)
Additions to equipment leased to others ....................................... (1,106,425) (1,264,381) (1,279,405) (12,770)
Proceeds from sales of fixed assets excluding
equipment leased to others ........................................................... 89,578 64,421 67,551 674
Proceeds from sales of equipment leased to others...................... 390,205 321,761 375,881 3,752
Purchases of marketable securities and security investments....... (957,296) (1,068,205) (1,151,640) (11,495)
Proceeds from sales of marketable securities and
security investments ........................................................................ 157,707 148,442 165,495 1,652
Proceeds upon maturity of marketable securities and
security investments ........................................................................ 533,325 676,729 821,915 8,204
Payment for additional investments in affiliated companies,
net of cash acquired........................................................................ (1,802) (1,651) (4,406) (44)
Changes in investments and other assets, and other .................... (77,606) (51,328) (74,687) (745)
Net cash used in investing activities .................................... (3,375,500) (3,814,378) (3,874,886) (38,675)
Cash flows from financing activities
Purchase of common stock............................................................... (129,629) (295,699) (311,667) (3,111)
Proceeds from issuance of long-term debt..................................... 1,928,788 2,890,000 3,349,812 33,434
Payments of long-term debt............................................................. (1,187,506) (1,726,823) (2,310,008) (23,056)
Increase in short-term borrowings ................................................... 509,826 353,397 408,912 4,081
Dividends paid................................................................................... (244,568) (339,107) (430,860) (4,300)
Net cash provided by financing activities............................ 876,911 881,768 706,189 7,048
Effect of exchange rate changes on cash and
cash equivalents................................................................................. 68,743 25,429 (84,759) (846)
Net increase (decrease) in cash and cash equivalents................... 85,634 330,992 (271,832) (2,713)
Cash and cash equivalents at beginning of year............................ 1,483,753 1,569,387 1,900,379 18,968
Cash and cash equivalents at end of year ....................................... ¥ 1,569,387 ¥ 1,900,379 ¥ 1,628,547 $ 16,255
The accompanying notes are an integral part of these consolidated financial statements.