Toyota 2008 Annual Report Download - page 79
Download and view the complete annual report
Please find page 79 of the 2008 Toyota annual report below. You can navigate through the pages in the report by either clicking on the pages listed below, or by using the keyword search tool below to find specific information within the annual report.-
 1
1 -
2
-
3
-
4
-
5
-
6
-
7
-
8
-
9
-
10
-
11
-
12
-
13
-
14
-
15
-
16
-
17
-
18
-
19
-
20
-
21
-
22
-
23
-
24
-
25
-
26
-
27
-
28
-
29
-
30
-
31
-
32
-
33
-
34
-
35
-
36
-
37
-
38
-
39
-
40
-
41
-
42
-
43
-
44
-
45
-
46
-
47
-
48
-
49
-
50
-
51
-
52
-
53
-
54
-
55
-
56
-
57
-
58
-
59
-
60
-
61
-
62
-
63
-
64
-
65
-
66
-
67
-
68
-
 69
69 -
 70
70 -
 71
71 -
 72
72 -
 73
73 -
 74
74 -
 75
75 -
 76
76 -
 77
77 -
 78
78 -
 79
79 -
 80
80 -
 81
81 -
 82
82 -
 83
83 -
 84
84 -
 85
85 -
 86
86 -
 87
87 -
 88
88 -
 89
89 -
90
-
91
-
92
-
93
-
94
-
95
-
96
-
97
-
98
-
99
-
100
-
101
-
102
-
103
-
104
-
105
-
106
-
107
-
108
-
109
-
110
-
111
-
112
-
113
-
114
-
115
-
116
-
117
-
118
-
119
-
120
-
121
-
122
-
123
-
124
-
125
-
126
-
127
-
128
-
129
-
130
-
131
-
132
-
133
-
134
-
135
-
136
-
137
-
138
 |
 |

77
•Annual Report 2008 • TOYOTA
Performance Messages from the Management &
•Overview •Management •Special Feature •Business Overview •Corporate Information •Financial Section •Investor Information •
■
■
During fiscal 2007 and 2008, the average value of the
Japanese yen fluctuated against the major currencies including
the U.S. dollar and the euro compared with the average value of
the previous fiscal year, respectively. The operating results
excluding the impact of currency fluctuations described in the
“Results of Operations—Fiscal 2008 Compared with Fiscal
2007” and the “Results of Operations—Fiscal 2007 Compared
with Fiscal 2006,” show results of net revenues obtained by
applying the Japanese yen’s average exchange rate in the pre-
vious fiscal year to the local currency-denominated net rev-
enues for fiscal 2007 and 2008, respectively, as if the value of
the Japanese yen had remained constant for the comparable
periods. Results excluding the impact of currency fluctuations
year-on-year are not on the same basis as Toyota’s consolidat-
ed financial statements and do not conform with U.S. GAAP.
Furthermore, Toyota does not believe that these measures are
a substitute for U.S. GAAP measures. However, Toyota believes
that such results excluding the impact of currency fluctuations
year-on-year provide additional useful information to investors
regarding the operating performance on a local currency basis.
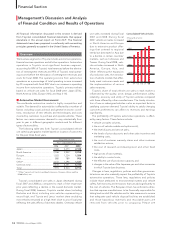
■Segmentation
Toyota’s most significant business segment is its automotive
operations. Toyota carries out its automotive operations as a
global competitor in the worldwide automotive market.
Management allocates resources to, and assesses the perfor-
mance of, its automotive operations as a single business seg-
ment on a worldwide basis. Toyota does not manage any subset
of its automotive operations, such as domestic or overseas
operations or parts, as separate management units.
The management of the automotive operations is aligned on
a functional basis with managers having oversight responsibility
for the major operating functions within the segment.
Management assesses financial and non-financial data such as
units of sale, units of production, market share information,
vehicle model plans and plant location costs to allocate
resources within the automotive operations.
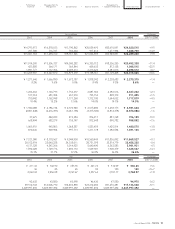
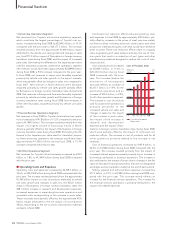
The following table sets forth
Toyota’s net revenues in each
geographic market based on
the country location of the par-
ent company or the subsidiary
that transacted the sale with the
external customer for the past
three fiscal years.
Yen in millions
For the years ended March 31,
2006 2007 2008
Japan .......................... ¥7,735,109 ¥8,152,884 ¥8,418,620
North America............ 7,455,818 8,771,495 9,248,950
Europe ........................ 2,574,014 3,346,013 3,802,814
Asia.............................. 1,836,855 1,969,957 2,790,987
Other*......................... 1,435,113 1,707,742 2,027,869
* “Other” consists of Central and South America, Oceania, Africa.
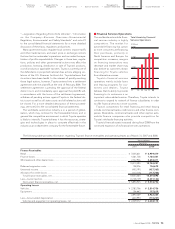
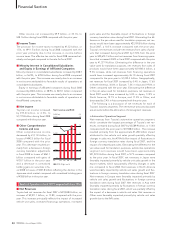
■Net Revenues
Toyota had net revenues for fis-
cal 2008 of ¥26,289.2 billion, an
increase of ¥2,341.2 billion, or
9.8%, compared with the prior
year. This increase principally
reflects the impact of increased
vehicle unit sales, increased
financings operations, increased
parts sales and the favorable
impact of fluctuations in foreign
currency translation rates during
fiscal 2008. Eliminating the differ-
ence in the Japanese yen value
used for translation purposes,
net revenues would have been
approximately ¥26,011.5 billion
during fiscal 2008, an 8.6%
increase compared with the prior
year. Toyota’s net revenues include net revenues from sales of
products that increased by 9.5% during fiscal 2008 compared
with the prior year to ¥24,820.5 billion and net revenues from
financing operations that increased by 14.9% during fiscal 2008
compared with the prior year to ¥1,468.7 billion. Eliminating the
difference in the Japanese yen value used for translation pur-
poses, net revenues from sales of products would have been
approximately ¥24,540.1 billion, an 8.2% increase during fiscal
2008 compared with the prior year, while net revenues from
financing operations would have increased by approximately
15.1% during fiscal 2008 compared to the prior year to ¥1,471.4
billion. Geographically, net revenues for fiscal 2008 increased
by 3.3% in Japan, 5.4% in North America, 13.7% in Europe,
41.7% in Asia and 18.7% in Other compared with the prior year.
Eliminating the difference in the Japanese yen value used for
translation purposes, net revenues in fiscal 2008 would have
increased by 3.3% in Japan, 7.6% in North America, 6.8% in
Europe, 34.2% in Asia, and 13.6 % in Other compared with the
prior year.
The following is a discussion of net revenues for each of
Toyota’s business segments. The net revenue amounts discussed
are amounts before the elimination of intersegment revenues.
Results of Operations—Fiscal 2008 Compared with Fiscal 2007
Geographic Breakdown
32.0%
14.5%
10.6%
7.7%
35.2%
Japan North America
All Other Markets
Europe
Asia
Revenues by Market
FY2008
’04FY ’05 ’06 ’07 ’08
0
12,000
6,000
18,000
30,000
24,000
(¥ Billion)
Net Revenues