Toyota 2008 Annual Report Download - page 127
Download and view the complete annual report
Please find page 127 of the 2008 Toyota annual report below. You can navigate through the pages in the report by either clicking on the pages listed below, or by using the keyword search tool below to find specific information within the annual report.-
 1
1 -
2
-
3
-
4
-
5
-
6
-
7
-
8
-
9
-
10
-
11
-
12
-
13
-
14
-
15
-
16
-
17
-
18
-
19
-
20
-
21
-
22
-
23
-
24
-
25
-
26
-
27
-
28
-
29
-
30
-
31
-
32
-
33
-
34
-
35
-
36
-
37
-
38
-
39
-
40
-
41
-
42
-
43
-
44
-
45
-
46
-
47
-
48
-
49
-
50
-
51
-
52
-
53
-
54
-
55
-
56
-
57
-
58
-
59
-
60
-
61
-
62
-
63
-
64
-
65
-
66
-
67
-
68
-
69
-
70
-
71
-
72
-
73
-
74
-
75
-
76
-
77
-
78
-
79
-
80
-
81
-
82
-
83
-
84
-
85
-
86
-
87
-
88
-
89
-
90
-
91
-
92
-
93
-
94
-
95
-
96
-
97
-
98
-
99
-
100
-
101
-
102
-
103
-
104
-
105
-
106
-
107
-
108
-
109
-
110
-
111
-
112
-
113
-
114
-
115
-
116
-
 117
117 -
 118
118 -
 119
119 -
 120
120 -
 121
121 -
 122
122 -
 123
123 -
 124
124 -
 125
125 -
 126
126 -
 127
127 -
 128
128 -
 129
129 -
 130
130 -
 131
131 -
 132
132 -
 133
133 -
 134
134 -
 135
135 -
 136
136 -
 137
137 -
138
 |
 |

125
•Annual Report 2008 • TOYOTA
Performance Messages from the Management &
•Overview •Management •Special Feature •Business Overview •Corporate Information •Financial Section •Investor Information •
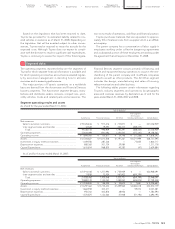
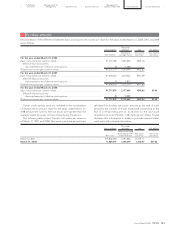
Revenues are attributed to geographies based on the coun-
try location of the parent company or the subsidiary that trans-
acted the sale with the external customer.
There are no any individually material countries with respect
to revenues, operating expenses, operating income, assets and
long-lived assets included in other foreign countries.
Unallocated amounts included in assets represent assets held
for corporate purposes, which mainly consist of cash and cash
equivalents and marketable securities. Such corporate assets
were ¥4,231,148 million, ¥4,758,410 million and ¥4,352,498 mil-
lion ($43,442 million), as of March 31, 2006, 2007 and 2008,
respectively.
Transfers between industries or geographic segments are
made at amounts which Toyota’s management believes
approximate arm’s-length transactions. In measuring the
reportable segments’ income or losses, operating income con-
sists of revenue less operating expenses.
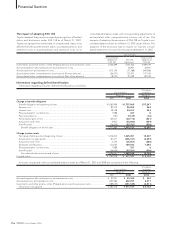
As of and for the year ended March 31, 2007:
Yen in millions
Inter-segment
Elimination/
Japan North America Europe Asia Other Unallocated Amount Consolidated
Net revenues
Sales to external customers......... ¥ 8,152,884 ¥ 8,771,495 ¥3,346,013 ¥1,969,957 ¥1,707,742 ¥ — ¥23,948,091
Inter-segment sales
and transfers................................ 6,662,398 258,278 196,180 255,571 215,000 (7,587,427) —
Total........................................... 14,815,282 9,029,773 3,542,193 2,225,528 1,922,742 (7,587,427) 23,948,091
Operating expenses..................... 13,358,036 8,580,140 3,404,810 2,107,933 1,839,245 (7,580,756) 21,709,408
Operating income ........................ ¥ 1,457,246 ¥ 449,633 ¥ 137,383 ¥ 117,595 ¥ 83,497 ¥ (6,671) ¥ 2,238,683
Assets............................................. ¥12,992,379 ¥10,890,157 ¥2,917,183 ¥1,563,742 ¥1,575,255 ¥ 2,636,063 ¥32,574,779
Long-lived assets .......................... 3,490,846 2,931,037 566,353 466,338 309,465 — 7,764,039
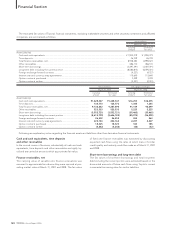
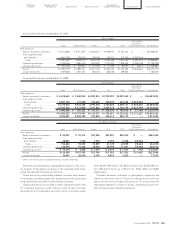
As of and for the year ended March 31, 2008:
Yen in millions
Inter-segment
Elimination/
Japan North America Europe Asia Other Unallocated Amount Consolidated
Net revenues
Sales to external customers......... ¥8,418,620 ¥ 9,248,950 ¥3,802,814 ¥2,790,987 ¥2,027,869 ¥ — ¥26,289,240
Inter-segment sales
and transfers................................ 6,897,192 174,308 190,620 329,839 266,268 (7,858,227) —
Total........................................... 15,315,812 9,423,258 3,993,434 3,120,826 2,294,137 (7,858,227) 26,289,240
Operating expenses..................... 13,875,526 9,117,906 3,851,863 2,864,470 2,150,159 (7,841,059) 24,018,865
Operating income ........................ ¥1,440,286 ¥ 305,352 ¥ 141,571 ¥ 256,356 ¥ 143,978 ¥ (17,168) ¥ 2,270,375
Assets............................................. ¥12,883,255 ¥10,779,947 ¥3,125,572 ¥1,792,681 ¥1,703,533 ¥ 2,173,332 ¥32,458,320
Long-lived assets .......................... 3,696,081 2,808,782 574,854 446,513 285,772 — 7,812,002
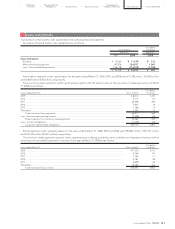
U.S. dollars in millions
Inter-segment
Elimination/
Japan North America Europe Asia Other Unallocated Amount Consolidated
Net revenues
Sales to external customers......... $84,027 $ 92,314 $37,956 $27,857 $20,240 $ — $262,394
Inter-segment sales
and transfers................................ 68,841 1,740 1,903 3,292 2,658 (78,434) —
Total........................................... 152,868 94,054 39,859 31,149 22,898 (78,434) 262,394
Operating expenses..................... 138,492 91,006 38,446 28,590 21,461 (78,262) 239,733
Operating income ........................ $14,376 $ 3,048 $ 1,413 $ 2,559 $ 1,437 $ (172) $ 22,661
Assets............................................. $128,588 $107,595 $31,196 $17,893 $17,003 $ 21,693 $323,968
Long-lived assets .......................... 36,891 28,034 5,738 4,457 2,852 — 77,972
* “Other” consists of Central and South America, Oceania and Africa.