Toyota 2008 Annual Report Download - page 82
Download and view the complete annual report
Please find page 82 of the 2008 Toyota annual report below. You can navigate through the pages in the report by either clicking on the pages listed below, or by using the keyword search tool below to find specific information within the annual report.-
 1
1 -
2
-
3
-
4
-
5
-
6
-
7
-
8
-
9
-
10
-
11
-
12
-
13
-
14
-
15
-
16
-
17
-
18
-
19
-
20
-
21
-
22
-
23
-
24
-
25
-
26
-
27
-
28
-
29
-
30
-
31
-
32
-
33
-
34
-
35
-
36
-
37
-
38
-
39
-
40
-
41
-
42
-
43
-
44
-
45
-
46
-
47
-
48
-
49
-
50
-
51
-
52
-
53
-
54
-
55
-
56
-
57
-
58
-
59
-
60
-
61
-
62
-
63
-
64
-
65
-
66
-
67
-
68
-
69
-
70
-
71
-
 72
72 -
 73
73 -
 74
74 -
 75
75 -
 76
76 -
 77
77 -
 78
78 -
 79
79 -
 80
80 -
 81
81 -
 82
82 -
 83
83 -
 84
84 -
 85
85 -
 86
86 -
 87
87 -
 88
88 -
 89
89 -
 90
90 -
 91
91 -
 92
92 -
93
-
94
-
95
-
96
-
97
-
98
-
99
-
100
-
101
-
102
-
103
-
104
-
105
-
106
-
107
-
108
-
109
-
110
-
111
-
112
-
113
-
114
-
115
-
116
-
117
-
118
-
119
-
120
-
121
-
122
-
123
-
124
-
125
-
126
-
127
-
128
-
129
-
130
-
131
-
132
-
133
-
134
-
135
-
136
-
137
-
138
 |
 |
80 TOYOTA •Annual Report 2008 •
Financial Section
Other income, net increased by ¥9.9 billion, or 35.1%, to
¥38.1 billion during fiscal 2008 compared with the prior year.
■Income Taxes
The provision for income taxes increased by ¥13.2 billion, or
1.5%, to ¥911.5 billion during fiscal 2008 compared with the
prior year primarily due to the increase in income before
income taxes. The effective tax rate for fiscal 2008 remained rel-
atively unchanged compared to the rate for fiscal 2007.
■Minority Interest in Consolidated Subsidiaries
and Equity in Earnings of Affiliated Companies
Minority interest in consolidated subsidiaries increased by ¥28.3
billion, or 56.9%, to ¥78.0 billion during fiscal 2008 compared
with the prior year. This increase was mainly due to an increase
in net income attributable to favorable results of operations at
consolidated subsidiaries.
Equity in earnings of affiliated companies during fiscal 2008
increased by ¥60.6 billion, or 28.9%, to ¥270.1 billion compared
with the prior year. This increase was mainly due to an increase
in net income attributable to favorable results of operations at
the affiliated companies.
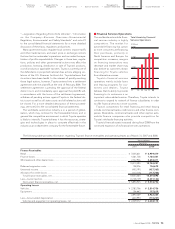
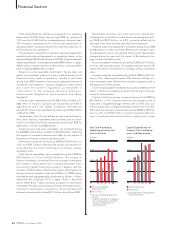
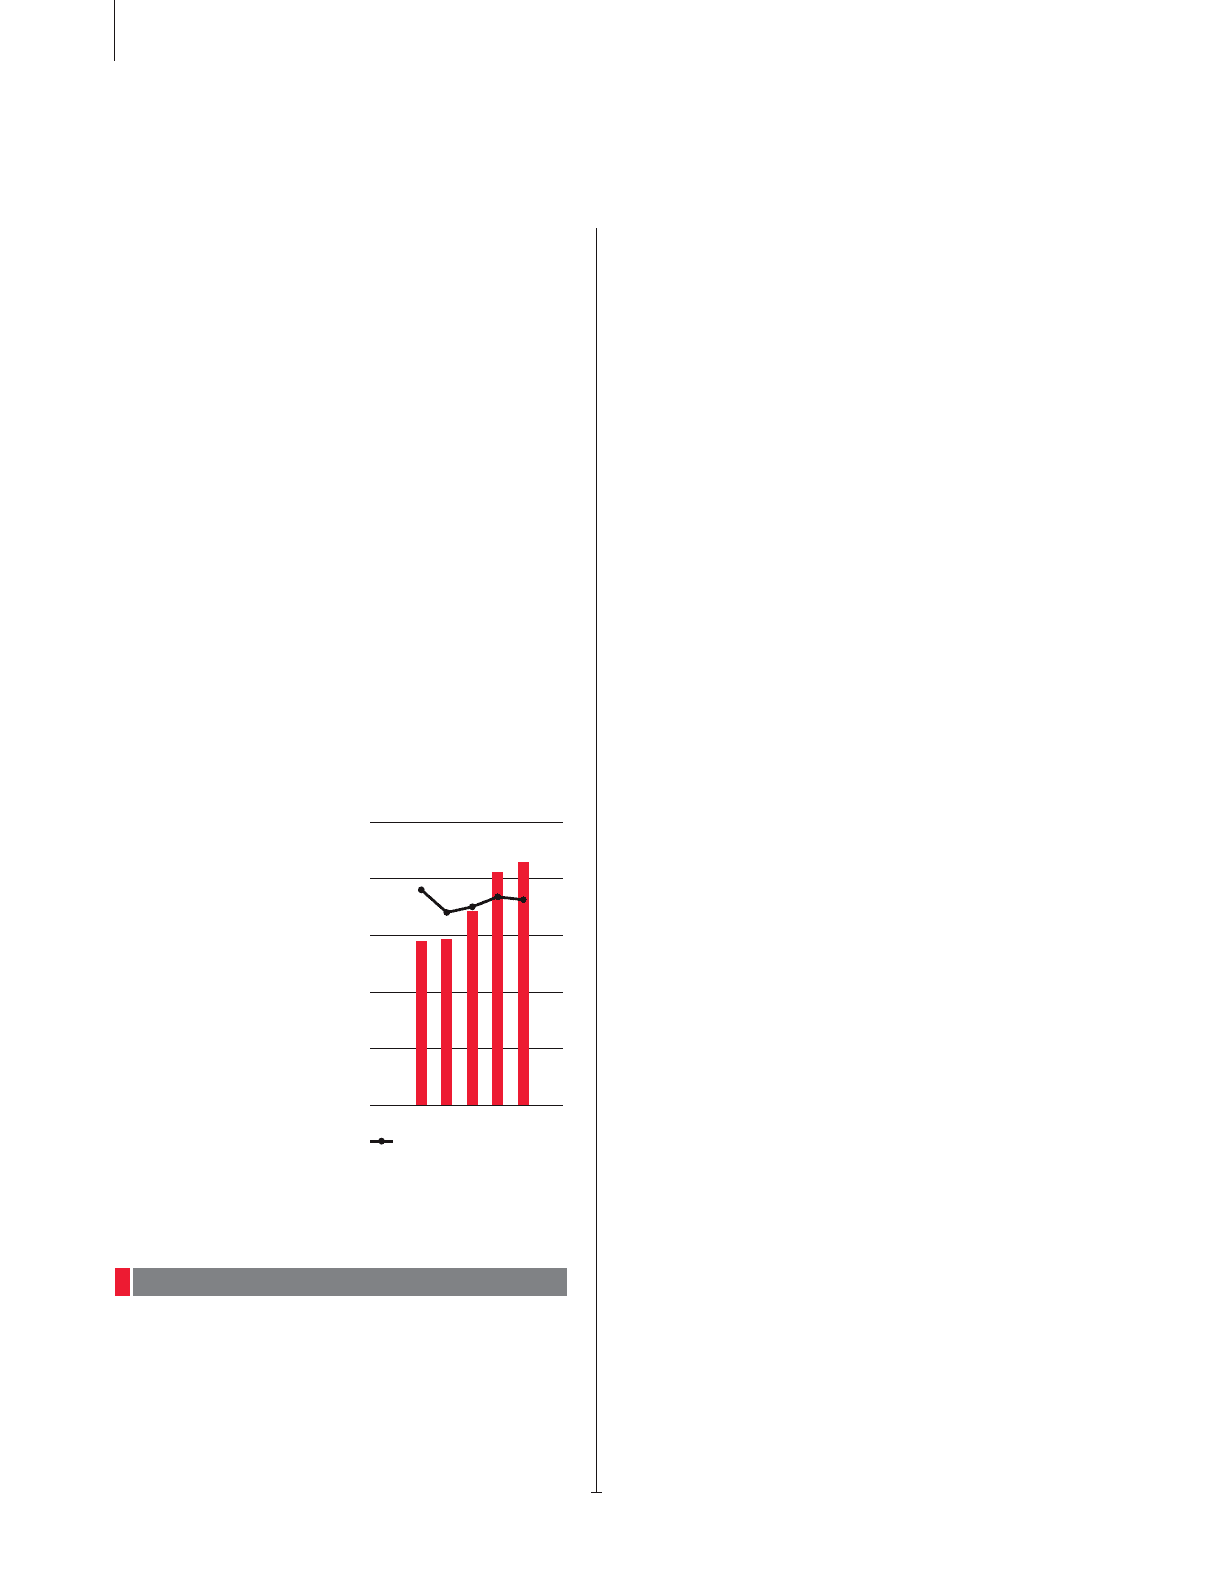
■Net Income
Toyota’s net income increased
by ¥73.8 billion, or 4.5%, to
¥1,717.8 billion during fiscal 2008
compared with the prior year.
■Other Comprehensive
Income and Loss
Other comprehensive income
decreased by ¥1,115.5 billion, to
losses of ¥942.5 billion for fiscal
2008 compared with the prior
year. This decrease resulted pri-
marily from a decrease in foreign
currency translation adjustments
in fiscal 2008 to losses of ¥461.1
billion compared with gains of
¥130.7 billion in the prior year
and a decrease in unrealized
holding gains on securities in fis-
cal 2008 to losses of ¥347.8 billion reflecting the decline in the
Japanese stock market compared with unrealized holding gains
of ¥38.8 billion in the prior year.
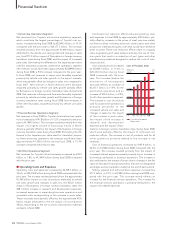
■Net Revenues
Toyota had net revenues for fiscal 2007 of ¥23,948.0 billion, an
increase of ¥2,911.1 billion, or 13.8%, compared with the prior
year. This increase principally reflects the impact of increased
vehicle unit sales, increased financings operations, increased
parts sales and the favorable impact of fluctuations in foreign
currency translation rates during fiscal 2007. Eliminating the dif-
ference in the yen value used for translation purposes, net rev-
enues would have been approximately ¥23,195.8 billion during
fiscal 2007, a 10.3% increase compared with the prior year.
Toyota’s net revenues include net revenues from sales of prod-
ucts that increased during fiscal 2007 by 13.0% from the prior
year to ¥22,670.1 billion and net revenues from financing opera-
tions that increased 30.8% in fiscal 2007 compared with the prior
year to ¥1,277.9 billion. Eliminating the difference in the yen
value used for translation purposes, net revenues from sales of
products would have been approximately ¥21,963.4 billion, a
9.5% increase, while net revenues from financing operations
would have increased approximately 26.1% during fiscal 2007
compared to the prior year to ¥1,232.4 billion. Geographically,
net revenues for fiscal 2007 increased by 5.4% in Japan, 17.6%
in North America, 30.0% in Europe, 7.2% in Asia and 19.0% in
Other compared with the prior year. Eliminating the difference
in the yen value used for translation purposes, net revenues in
fiscal 2007 would have increased by 5.4% in Japan, 13.9% in
North America, 19.7% in Europe, and 17.0% in Other, and
decreased by 2.4% in Asia compared with the prior year.
The following is a discussion of net revenues for each of
Toyota’s business segments. The net revenue amounts discussed
are amounts before the elimination of intersegment revenues.
• Automotive Operations Segment
Net revenues from Toyota’s automotive operations segment,
which constitute the largest percentage of Toyota’s net rev-
enues, increased during fiscal 2007 by ¥2,589.9 billion, or 13.4%
compared with the prior year to ¥21,928.0 billion. The increase
resulted primarily from the approximate ¥1,200 billion impact
attributed to the vehicle unit sales growth partially offset by
changes in sales mix, the ¥704.6 billion impact of fluctuations in
foreign currency translation rates during fiscal 2007, and the
impact of increased parts sales. Eliminating the difference in the
yen value used for translation purposes, automotive operations
segment net revenues would have been approximately
¥21,223.4 billion during fiscal 2007, a 9.7% increase compared
to the prior year. In fiscal 2007, net revenues in Japan were
favorably impacted primarily by vehicle unit sales growth in the
export markets, which was partially offset by changes in sales
mix compared to fiscal 2006. Net revenues in North America
were favorably impacted by vehicle unit sales growth and fluc-
tuations in foreign currency translation rates during fiscal 2007.
Net revenues in Europe were favorably impacted primarily by
vehicle unit sales growth and fluctuations in foreign currency
translation rates during fiscal 2007. Net revenues in Asia were
favorably impacted primarily by fluctuations in foreign currency
translation rates during fiscal 2007, which was partially offset by
the impact of a decrease in vehicle unit sales. Net revenues in
Other were favorably impacted primarily by vehicle unit sales
growth due to the IMV series.
Results of Operations—Fiscal 2007 Compared with Fiscal 2006
■
■
’04FY ’05 ’06 ’07 ’08
0
800
400
1,200
2,000
1,600
0
8
4
12
20
16
(¥ Billion) (%)
ROE (Right scale)
Net Income and ROE