Walmart 2010 Annual Report Download - page 11
Download and view the complete annual report
Please find page 11 of the 2010 Walmart annual report below. You can navigate through the pages in the report by either clicking on the pages listed below, or by using the keyword search tool below to find specific information within the annual report.-
 1
1 -
 2
2 -
 3
3 -
 4
4 -
 5
5 -
 6
6 -
 7
7 -
 8
8 -
 9
9 -
 10
10 -
 11
11 -
 12
12 -
 13
13 -
 14
14 -
 15
15 -
 16
16 -
 17
17 -
 18
18 -
 19
19 -
 20
20 -
 21
21 -
 22
22 -
23
-
24
-
25
-
26
-
27
-
28
-
29
-
30
-
31
-
32
-
33
-
34
-
35
-
36
-
37
-
38
-
39
-
40
-
41
-
42
-
43
-
44
-
45
-
46
-
47
-
48
-
49
-
50
-
51
-
52
-
53
-
54
-
55
-
56
-
57
-
58
-
59
-
60
 |
 |

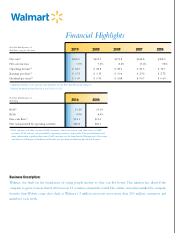
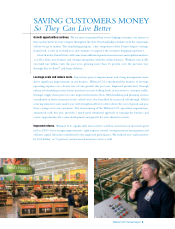
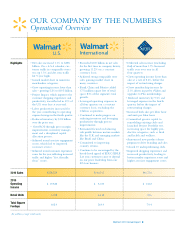
• Net sales increased 1.1% to $258
billion. On a 4-5-4 calendar, cus-
tomer traffic in comparable stores
was up 1.3% and dot.com traffic
hit 9-year highs.
• Gained market share in numerous
merchandise categories.
• Grew operating income faster than
sales – growing 5.2% to $19.5 billion.
• Project Impact, which improves the
customer shopping experience and
productivity, was reflected in 31% of
the U.S. store base at year-end.
•
Labor productivity increased for
the year, contributing to operating
expense leverage in the fourth quarter.
• Reduced inventory by $1.8 billion
over the prior year.
• Grew ROI through gross margin
improvements, inventory manage-
ment and a disciplined capital
allocation process.
•
Achieved record associate engagement
scores, which led to improved
customer service.
•
Achieved record customer experience
scores for the year, reflecting increased
traffic and higher “fast, friendly,
clean” scores.
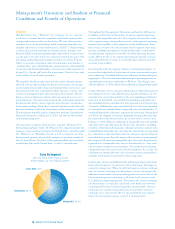
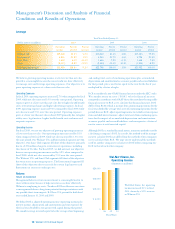
2010 Sales
Highlights
2010
Operating
Income
Retail Units
OUR COMPANY BY THE NUMBERS
Operational Overview
$258,229
International
$ 19,522
U.S.
U.S.
$100,107
$ 5,033
$46,710
$ 1,512
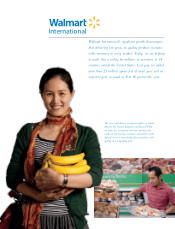
• Exceeded $100 billion in net sales
for the first time in company history,
growing 11.2% on a constant
currency basis.
• Achieved strong comparable store
sales, gaining market share in
many countries.
• Brazil, China and Mexico added
17.5 million square feet of retail
space, 83% of the segment’s total
growth.
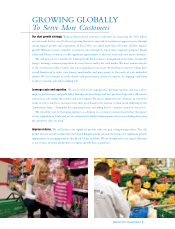
•
Leveraged operating expenses in
all four quarters on a constant
currency basis, excluding the
Chilean acquisition.
• Continued to make progress on
reducing inventory and leveraging
productivity through process
improvements.
• Remained focused on balancing
risk profile between mature markets
like the U.K. and emerging markets
like Brazil and China.
•
Committed to improving
country returns.
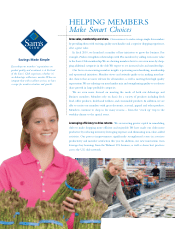
• Continue to be encouraged by the
broad-based appeal of EDLC/EDLP.
Last year, customers came to depend
on our price leadership from our
52 store banners.
•
Delivered sales increase (excluding
fuel) of more than 1.7%. Increased
traffic year over year in all
four quarters.
• Grew operating income faster than
sales at a rate of 2.4%, before the
impact of restructuring charges.
•
Grew membership income by
2.1%, driven in part by eValues and
upgrades to Plus memberships.
• Reduced inventory by 9.5% and
leveraged expenses in the fourth
quarter, before the impact of
restructuring charges.
• Increased both sales per labor hour
and units per labor hour.
•
Committed greater capital to
remodeling existing clubs and
launched Project Portfolio test,
increasing space for highly pro-
ductive categories, such as fresh
and health and wellness.
•
Announced new product demo
program to drive branding and sales.
• Closed 10 underperforming clubs.
• Improved shopping experience and
increased productivity, leading to
better member experience scores and
higher associate engagement scores.
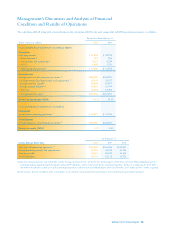
3,708 4,112 596
Walmart 2010 Annual Report 9
Total Square
Footage 602.9 269.9 79.4
(In millions, except retail units)