Walmart 2010 Annual Report Download - page 18
Download and view the complete annual report
Please find page 18 of the 2010 Walmart annual report below. You can navigate through the pages in the report by either clicking on the pages listed below, or by using the keyword search tool below to find specific information within the annual report.-
 1
1 -
2
-
3
-
4
-
5
-
6
-
7
-
 8
8 -
 9
9 -
 10
10 -
 11
11 -
 12
12 -
 13
13 -
 14
14 -
 15
15 -
 16
16 -
 17
17 -
 18
18 -
 19
19 -
 20
20 -
 21
21 -
 22
22 -
 23
23 -
 24
24 -
 25
25 -
 26
26 -
 27
27 -
 28
28 -
29
-
30
-
31
-
32
-
33
-
34
-
35
-
36
-
37
-
38
-
39
-
40
-
41
-
42
-
43
-
44
-
45
-
46
-
47
-
48
-
49
-
50
-
51
-
52
-
53
-
54
-
55
-
56
-
57
-
58
-
59
-
60
 |
 |
Overview
Wal-Mart Stores, Inc. (“Walmart,” the “company” or “we”) operates
retail stores in various formats around the world and is committed to
saving people money so they can live better. We earn the trust of our
customers every day by providing a broad assortment of quality mer-
chandise and services at every day low prices (“EDLP”), while fostering
a culture that rewards and embraces mutual respect, integrity and
diversity. EDLP is our pricing philosophy under which we price items
at a low price every day so that our customers trust that our prices will
not change under frequent promotional activity. Our focus for Sam’s
Club is to provide exceptional value on brand name merchandise at
“members only” prices for both business and personal use. Internationally,
we operate with similar philosophies. Our fiscal year ends on January 31
for our U.S., Canada and Puerto Rico operations. Our fiscal year ends
on December 31 for all other operations.
We intend for this discussion to provide the reader with information
that will assist in understanding our financial statements, the changes
in certain key items in those financial statements from year to year, and
the primary factors that accounted for those changes, as well as how
certain accounting principles affect our financial statements. We also
discuss certain performance metrics that management uses to assess
our performance. The discussion also provides information about the
financial results of the various segments of our business to provide a
better understanding of how those segments and their results affect the
financial condition and results of operations of the company as a whole.
This discussion should be read in conjunction with our Consolidated
Financial Statements as of January 31, 2010, and the year then ended,
and accompanying notes.
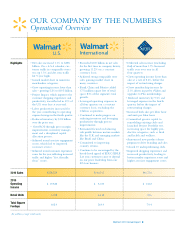
Our operations comprise three business segments: Walmart U.S.,
International and Sam’s Club. The Walmart U.S. segment includes the
company’s mass merchant concept in the United States, operating under
the “Walmart” or “Wal-Mart” brand, as well as walmart.com. The
International segment consists of the company’s operations outside of
the 50 United States. The Sam’s Club segment includes the warehouse
membership clubs in the United States, as well as samsclub.com.
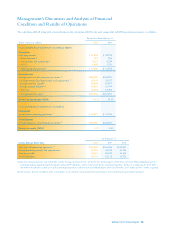
Throughout this Management’s Discussion and Analysis of Financial
Condition and Results of Operations, we discuss segment operating
income and comparable store sales. The company measures the results
of its segments using, among other measures, each segment’s operating
income which includes certain corporate overhead allocations. From
time to time, we revise the measurement of each segment’s operating
income, including any corporate overhead allocations, as dictated by
the information regularly reviewed by our chief operating decision
maker. When we do so, the segment operating income for each seg-
ment affected by the revisions is restated for all periods presented to
maintain comparability.
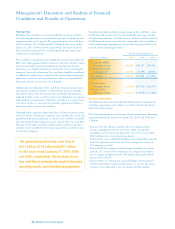
In connection with the company’s finance transformation project, we
reviewed and adjusted the classification of certain revenue and expense
items within our Consolidated Statements of Income for financial report-
ing purposes. The reclassifications did not impact operating income or
consolidated net income attributable to Walmart. The changes were
effective February 1, 2009 and have been reflected in all periods presented.
Comparable store sales is a measure which indicates the performance of
our existing U.S. stores and clubs by measuring the growth in sales for
such stores for a particular period over the corresponding period in the
prior year. In fiscal 2008, our method of calculating comparable store
sales included all stores and clubs that were open for at least the previous
12 months. Additionally, stores and clubs that were relocated, expanded
or converted were excluded from comparable store sales for the first 12
months following the relocation, expansion or conversion. During fiscal
year 2008, the company reviewed its definition of comparable store sales
for consistency with other retailers. As a result of that review, since
February 1, 2008, Walmart’s definition of comparable store sales includes
sales from stores and clubs open for the previous 12 months, including
remodels, relocations and expansions. Changes in format continue to be
excluded from comparable store sales when the conversion is accompanied
by a relocation or expansion that results in a change in square footage of
more than five percent. Since the impact of this revision is inconsequential,
the company will not restate comparable store sales results for previously
reported years. Comparable store sales are also referred to as “same-store”
sales by others within the retail industry. The method of calculating
comparable store sales varies across the retail industry. As a result, our
calculation of comparable store sales is not necessarily comparable to
similarly titled measures reported by other companies.
In discussions of our consolidated results and the operating results of our
International segment, we sometimes refer to the impact of changes in
currency exchange rates. When we refer to changes in currency exchange
rates or currency exchange rate fluctuations, we are referring to the
differences between the currency exchange rates we use to convert the
International segment’s operating results from local currencies into
U.S. dollars for reporting purposes. The impacts of currency exchange
rate fluctuations are typically calculated as the difference between
current period activity translated using the current period’s currency
exchange rates and the comparable prior year period’s currency
exchange rates, respectively. We use this method for all countries
where the functional currency is not U.S. denominated.
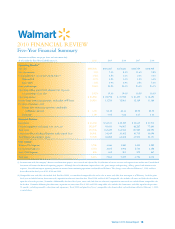
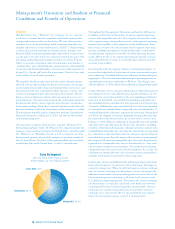
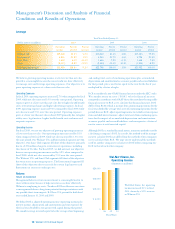
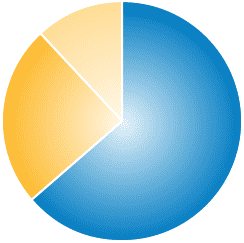
Sales By Segment
Net sales in fiscal 2010 were a record
$405.0 billion, up 1.0% from fiscal 2009.
Management’s Discussion and Analysis of Financial
Condition and Results of Operations
16 Walmart 2010 Annual Report
Walmart U.S.
63.8%
International
24.7%
Sam’s Club
11.5%