Walmart 2010 Annual Report Download - page 26
Download and view the complete annual report
Please find page 26 of the 2010 Walmart annual report below. You can navigate through the pages in the report by either clicking on the pages listed below, or by using the keyword search tool below to find specific information within the annual report.-
 1
1 -
2
-
3
-
4
-
5
-
6
-
7
-
8
-
9
-
10
-
11
-
12
-
13
-
14
-
15
-
 16
16 -
 17
17 -
 18
18 -
 19
19 -
 20
20 -
 21
21 -
 22
22 -
 23
23 -
 24
24 -
 25
25 -
 26
26 -
 27
27 -
 28
28 -
 29
29 -
 30
30 -
 31
31 -
 32
32 -
 33
33 -
 34
34 -
 35
35 -
 36
36 -
37
-
38
-
39
-
40
-
41
-
42
-
43
-
44
-
45
-
46
-
47
-
48
-
49
-
50
-
51
-
52
-
53
-
54
-
55
-
56
-
57
-
58
-
59
-
60
 |
 |

Capital Resources
During fiscal 2010, we issued $5.5 billion of long-term debt. The net
proceeds from the issuance of such long-term debt were used for general
corporate purposes. During fiscal 2009, we issued $6.6 billion of long-term
debt. Those net proceeds were used to repay outstanding commercial
paper indebtedness and for other general corporate purposes.
Management believes that cash flows from continuing operations and
proceeds from the issuance of short-term borrowings will be sufficient
to finance seasonal buildups in merchandise inventories and meet other
cash requirements. If our operating cash flows are not sufficient to pay
dividends and to fund our capital expenditures, we anticipate funding
any shortfall in these expenditures with a combination of short-term
borrowings and long-term debt. We plan to refinance existing long-term
debt as it matures and may desire to obtain additional long-term
financing for other corporate purposes. We anticipate no difficulty in
obtaining long-term financing in view of our credit ratings and favor-
able experiences in the debt market in the recent past. The following table
details the ratings of the credit rating agencies that rated our outstanding
indebtedness at January 31, 2010. The rating agency ratings are not
recommendations to buy, sell or hold our commercial paper or debt
securities. Each rating may be subject to revision or withdrawal at
any time by the assigning rating organization and should be evaluated
independently of any other rating.
Rating Agency Commercial Paper Long-term Debt
Standard & Poor’s A-1+ AA
Moody’s Investors Service P-1 Aa2
Fitch Ratings F1+ AA
DBRS Limited R-1(middle) AA
To monitor our credit ratings and our capacity for long-term financing,
we consider various qualitative and quantitative factors. We monitor the
ratio of our debt to our total capitalization as support for our long-term
financing decisions. At January 31, 2010 and January 31, 2009, the ratio of
our debt to total capitalization was 36.9% and 39.3%, respectively. For
the purpose of this calculation, debt is defined as the sum of short-term
borrowings, long-term debt due within one year, obligations under capital
leases due in one year, long-term debt and long-term obligations under
capital leases. Total capitalization is defined as debt plus total Walmart
shareholders’ equity. Our ratio of debt to our total capitalization decreased
in fiscal 2010 primarily due to a decrease in short-term borrowings.
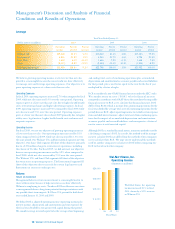
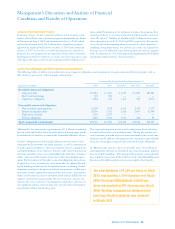
Global Expansion Activities
Cash paid for property and equipment was $12.2 billion, $11.5 billion and
$14.9 billion during the fiscal years ended January 31, 2010, 2009 and
2008, respectively. These expenditures primarily relate to new store
growth, as well as remodeling costs for existing stores.
We expect to incur capital expenditures of approximately $13.0 billion
to $15.0 billion in fiscal 2011. We plan to finance this expansion and any
acquisitions of other operations that we may make during fiscal 2011
primarily from cash flows from operations.
Fiscal 2011 capital expenditures will include the addition of the following
new, relocated and expanded units in the U.S.:
Fiscal Year 2011
Projected Unit Growth
Walmart U.S. Segment 145-160
Sam’s Club Segment 5-10
Total U.S. 150-170
Additionally, the International segment expects to add more than 600
units during fiscal year 2011.
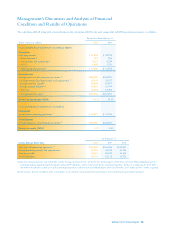
The following represents an allocation of our capital expenditures:
Allocation of Capital Expenditures
Projected Actual
Fiscal Year Fiscal Year Fiscal Year
Capital Expenditures 2011 2010 2009
New stores, including
expansions and relocations 31% 29% 34%
Remodels 15% 17% 10%
Information systems,
distribution and other 21% 23% 20%
Total U.S. 67% 69% 64%
International 33% 31% 36%
Total Capital Expenditures 100% 100% 100%
Common Stock Dividends
We paid dividends of $1.09 per share in fiscal 2010, representing a
15% increase over fiscal 2009. The fiscal 2009 dividend of $0.95 per
share represented an 8% increase over fiscal 2008. We have increased
our dividend every year since the first dividend was declared in
March 1974.
On March 4, 2010, the company’s Board of Directors approved an
increase in the annual dividend for fiscal 2011 to $1.21 per share, an
increase of 11% over the dividends paid in fiscal 2010. The annual divi-
dend will be paid in four quarterly installments on April 5, 2010, June 1,
2010, September 7, 2010 and January 3, 2011 to holders of record on
March 12, May 14, August 13 and December 10, 2010, respectively.
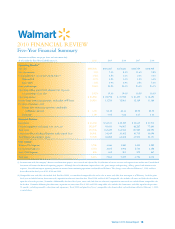
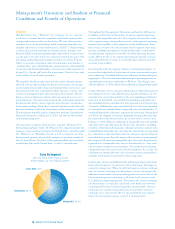
Management’s Discussion and Analysis of Financial
Condition and Results of Operations
24 Walmart 2010 Annual Report
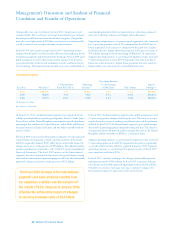
We expect to incur capital expenditures of
approximately $13.0 billion to $15.0 billion in
fiscal 2011. We plan to finance this expansion
and any acquisitions of other operations that
we may make during fiscal 2011 primarily
from cash flows from operations.