Walmart 2010 Annual Report Download - page 40
Download and view the complete annual report
Please find page 40 of the 2010 Walmart annual report below. You can navigate through the pages in the report by either clicking on the pages listed below, or by using the keyword search tool below to find specific information within the annual report.-
 1
1 -
2
-
3
-
4
-
5
-
6
-
7
-
8
-
9
-
10
-
11
-
12
-
13
-
14
-
15
-
16
-
17
-
18
-
19
-
20
-
21
-
22
-
23
-
24
-
25
-
26
-
27
-
28
-
29
-
 30
30 -
 31
31 -
 32
32 -
 33
33 -
 34
34 -
 35
35 -
 36
36 -
 37
37 -
 38
38 -
 39
39 -
 40
40 -
 41
41 -
 42
42 -
 43
43 -
 44
44 -
 45
45 -
 46
46 -
 47
47 -
 48
48 -
 49
49 -
 50
50 -
51
-
52
-
53
-
54
-
55
-
56
-
57
-
58
-
59
-
60
 |
 |

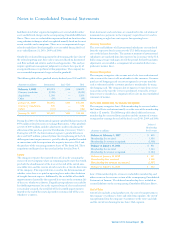
The company had trade letters of credit outstanding totaling $2.4 billion
at January 31, 2010 and 2009. At January 31, 2010 and 2009, the company
had standby letters of credit outstanding totaling $2.4 billion and $2.0
billion, respectively. These letters of credit were issued primarily for the
purchase of inventory and self-insurance purposes.
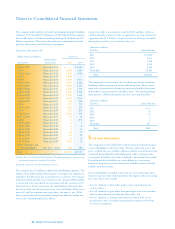
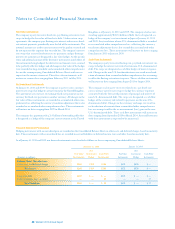
Long-term debt consists of:
(Dollar amounts in millions) January 31,
Maturity Date
Interest Rate by Fiscal Year 2010 2009
1.200-10.96% Notes due 2010 $ — $ 5,656
5.250% Notes due 2036 4,098 3,954
0.184-10.880% Notes due 2011
(1)
3,972 2,952
5.625% Notes due 2035 1,598 —
6.500% Notes due 2038 3,000 3,000
0.750-15.27% Notes due 2014 3,919 4,822
1.200-4.125% Notes due 2012 4,481 5,353
5.750-7.550% Notes due 2031 1,799 1,727
4.875-6.200% Notes due 2039 3,598 2,954
2.950-6.500% Notes due 2019
(1)
1,769 1,305
3.750-5.375% Notes due 2018 1,032 1,006
3.150-6.630% Notes due 2016 766 940
5.875% Notes due 2028 777 772
1.600-5.000% Notes due 2013 1,363 561
6.750% Notes due 2024 262 263
2.300-3.000% Notes due 2015 2,704 575
2.000-2.500% Notes due 2017 27 32
4.125% Notes due 2020 6 507
4.200-5.500% Notes due 2021 6 7
4.200-5.500% Notes due 2022 6 8
4.200-5.500% Notes due 2023 8 10
4.200-5.500% Notes due 2025 16 17
4.200-5.500% Notes due 2026 20 20
4.200-5.500% Notes due 2027 23 19
4.200-5.500% Notes due 2029 1,401 12
Other (mortgages and
sale/leasebacks)
(2)
Due 2011 - 2038 630 725
Total $37,281 $37,197
(1) Notes due in 2011 and 2019 both include $500 million put options. Contains early
termination arrangements totaling $109 million.
(2) Includes adjustments to debt hedged by derivatives.
The company has $1.0 billion in debt with embedded put options. The
holders of one $500 million debt issuance may require the company to
repurchase the debt at par plus accrued interest at any time. One issuance
of money market puttable reset securities in the amount of $500 million
is structured to be remarketed in connection with the annual reset of
the interest rate. If, for any reason, the remarketing of the notes does
not occur at the time of any interest rate reset, the holders of the notes
must sell, and the company must repurchase, the notes at par. All of
these issuances have been classified as long-term debt due within one
year in the Consolidated Balance Sheets.
Long-term debt is unsecured except for $267 million, which is
collateralized by property with an aggregate carrying amount of
approximately $1.2 billion. Annual maturities of long-term debt
during the next f ive years and thereafter are:
(Amounts in millions)
Fiscal Year Annual Maturity
2011 $ 4,050
2012 4,611
2013 1,438
2014 4,150
2015 2,749
Thereafter 20,283
Total $37,281
The company has entered into sale/leaseback transactions involving
buildings while retaining title to the underlying land. These transac-
tions were accounted for as financings and are included in long-term
debt and the annual maturities schedules above. The resulting obliga-
tions mature as follows during the next five years and thereafter:
(Amounts in millions)
Fiscal Year Annual Maturity
2011 $ 10
2012 10
2013 10
2014 7
2015 7
Thereafter 277
Total $321
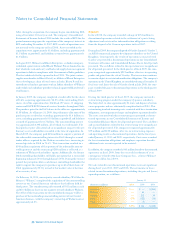
5 Fair Value Measurements
The company records and discloses certain financial and nonfinancial
assets and liabilities at their fair value. The fair value of an asset is the
price at which the asset could be sold in an orderly transaction between
unrelated, knowledgeable and willing parties able to engage in the
transaction. A liability’s fair value is defined as the amount that would
be paid to transfer the liability to a new obligor in a transaction
between such parties, not the amount that would be paid to settle the
liability with the creditor.
Assets and liabilities recorded at fair value are measured using a three-
tier fair value hierarchy, which prioritizes the inputs used in measuring
fair value. These tiers include:
• Level 1, defined as observable inputs such as quoted prices in
active markets;
• Level 2, defined as inputs other than quoted prices in active markets
that are either directly or indirectly observable; and
• Level 3, defined as unobservable inputs in which little or no
market data exists, therefore requiring the company to develop
our own assumptions.
Notes to Consolidated Financial Statements
38 Walmart 2010 Annual Report