Walmart 2010 Annual Report Download - page 25
Download and view the complete annual report
Please find page 25 of the 2010 Walmart annual report below. You can navigate through the pages in the report by either clicking on the pages listed below, or by using the keyword search tool below to find specific information within the annual report.-
 1
1 -
2
-
3
-
4
-
5
-
6
-
7
-
8
-
9
-
10
-
11
-
12
-
13
-
14
-
 15
15 -
 16
16 -
 17
17 -
 18
18 -
 19
19 -
 20
20 -
 21
21 -
 22
22 -
 23
23 -
 24
24 -
 25
25 -
 26
26 -
 27
27 -
 28
28 -
 29
29 -
 30
30 -
 31
31 -
 32
32 -
 33
33 -
 34
34 -
 35
35 -
36
-
37
-
38
-
39
-
40
-
41
-
42
-
43
-
44
-
45
-
46
-
47
-
48
-
49
-
50
-
51
-
52
-
53
-
54
-
55
-
56
-
57
-
58
-
59
-
60
 |
 |

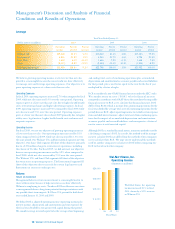
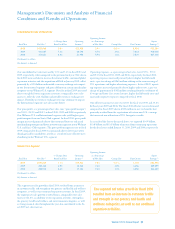
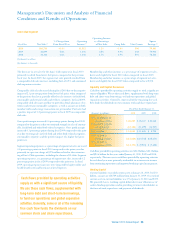
Sam’s Club Segment
Operating Income
% Change from Operating as a Percentage Square
Fiscal Year Net Sales
(1)
Prior Fiscal Year Income
(1)
of Net Sales Comp Sales Unit Counts Footage
(2
)
2010 $46,710 -0.4% $1,512 3.2% -1.4% 596 79,401
2009 46,899 5.8% 1,646 3.5% 4.9% 602 79,906
2008 44,336 6.6% 1,648 3.7% 4.9% 591 78,236
(1) Amounts in millions
(2) Amounts in thousands
The decrease in net sales for the Sam’s Club segment in fiscal 2010
primarily resulted from lower fuel prices compared to the previous
fiscal year. In fiscal 2009, the segment net sales growth resulted from
a comparable club sales increase, including fuel, of 4.9% and continued
club expansion activities.
Comparable club sales decreased during fiscal 2010 due to the negative
impact of 2.1 percentage points from lower fuel prices when compared
to the previous fiscal year, partially offset by sales increases in fresh food,
consumables and certain health and wellness categories. In fiscal 2009,
comparable club sales increased due to growth in food, pharmacy, elec-
tronics and certain consumables categories, as well as an increase in both
member traffic and average transaction size per member. Fuel sales had
a positive impact of 1.2 percentage points in fiscal 2009 on comparable
club sales.
Gross profit margin increased 0.6 percentage points during fiscal 2010
compared to the prior year due to continued strength in sales of consum-
able, fresh food and other food-related categories. Gross profit margin
increased 0.1 percentage points during fiscal 2009 compared to the prior
year due to strong sales in fresh food and other food-related categories,
consumable categories and the positive impact of a higher fuel gross
profit rate.
Segment operating expenses, as a percentage of segment net sales, increased
0.8 percentage points in fiscal 2010 compared to the prior year due
primarily to a pre-tax charge of $174 million related to the restructur-
ing of Sam’s Club operations, including the closure of 10 clubs. Segment
operating expenses, as a percentage of segment net sales, increased 0.2
percentage points in fiscal 2009 compared to the prior year. In fiscal
2009, operating expense increases were impacted by higher utility and
health benefit costs and hurricane-related expenses.
Membership and other income, as a percentage of segment net sales,
decreased slightly for fiscal 2010 when compared to fiscal 2009.
Membership and other income, as a percentage of segment net sales,
decreased slightly for fiscal 2009 when compared to fiscal 2008.
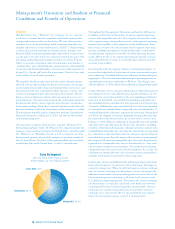
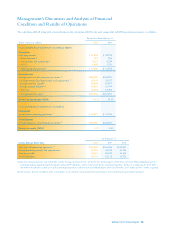
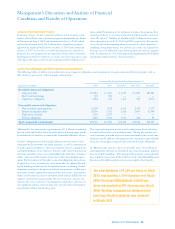
Liquidity and Capital Resources
Cash flows provided by operating activities supply us with a significant
source of liquidity. We use these cash flows, supplemented with long-term
debt and short-term borrowings, to fund our operations and global
expansion activities. Generally, some or all of the remaining free cash
flow funds the dividends on our common stock and share repurchases.
Fiscal Years Ended January 31,
(Amounts in millions) 2010 2009 2008
Net cash provided by
operating activities $ 26,249 $ 23,147 $ 20,642
Payments for property
and equipment (12,184) (11,499) (14,937)
Free cash flow $ 14,065 $ 11,648 $ 5,705
Net cash used in
investing activities $(11,620) $(10,742) $(15,670)
Net cash used in
financing activities $(14,191) $ (9,918) $ (7,422)
Cash flow provided by operating activities was $26.2 billion, $23.1 billion
and $20.6 billion for the years ended January 31, 2010, 2009 and 2008,
respectively. The increases in cash flows provided by operating activities
for each fiscal year were primarily attributable to an increase in income
from continuing operations and improved working capital management.
Working Capital
Current liabilities exceeded current assets at January 31, 2010, by $7.2
billion, an increase of $789 million from January 31, 2009. Our ratio of
current assets to current liabilities was 0.9 at January 31, 2010 and 2009.
We generally have a working capital deficit due to our efficient use of
cash in funding operations and in providing returns to shareholders in
the form of stock repurchases and payment of dividends.
Management’s Discussion and Analysis of Financial
Condition and Results of Operations
Walmart 2010 Annual Report 23
Cash flows provided by operating activities
supply us with a significant source of liquidity.
We use these cash flows, supplemented with
long-term debt and short-term borrowings,
to fund our operations and global expansion
activities. Generally, some or all of the remaining
free cash flow funds the dividends on our
common stock and share repurchases.