Walmart 2010 Annual Report Download - page 17
Download and view the complete annual report
Please find page 17 of the 2010 Walmart annual report below. You can navigate through the pages in the report by either clicking on the pages listed below, or by using the keyword search tool below to find specific information within the annual report.-
 1
1 -
2
-
3
-
4
-
5
-
6
-
 7
7 -
 8
8 -
 9
9 -
 10
10 -
 11
11 -
 12
12 -
 13
13 -
 14
14 -
 15
15 -
 16
16 -
 17
17 -
 18
18 -
 19
19 -
 20
20 -
 21
21 -
 22
22 -
 23
23 -
 24
24 -
 25
25 -
 26
26 -
 27
27 -
28
-
29
-
30
-
31
-
32
-
33
-
34
-
35
-
36
-
37
-
38
-
39
-
40
-
41
-
42
-
43
-
44
-
45
-
46
-
47
-
48
-
49
-
50
-
51
-
52
-
53
-
54
-
55
-
56
-
57
-
58
-
59
-
60
 |
 |

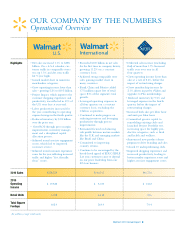
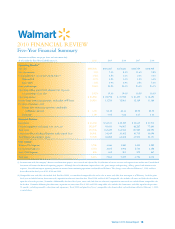
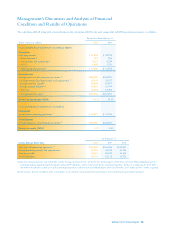
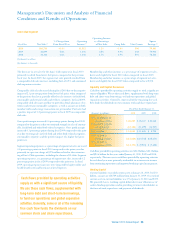
(Amounts in millions except per share and unit count data)
As of and for the Fiscal Years Ended January 31, 2010 2009 2008 2007 2006
Operating Results
(1)
Net sales $405,046 $401,087 $373,821 $344,759 $308,945
Net sales increase 1.0% 7.3% 8.4% 11.6% 9.8%
Comparable store sales in the United States
(2)
-0.8% 3.5% 1.6% 2.0% 3.4%
Walmart U.S. -0.7% 3.2% 1.0% 1.9% 3.0%
Sam’s Club -1.4% 4.9% 4.9% 2.5% 5.0%
Gross profit margin 24.8% 24.2% 24.0% 23.4% 23.1%
Operating, selling, general and administrative expenses,
as a percentage of net sales 19.7% 19.3% 19.0% 18.5% 18.0%
Operating income $ 23,950 $ 22,798 $ 21,952 $ 20,497 $ 18,693
Income from continuing operations attributable to Walmart 14,414 13,254 12,863 12,189 11,386
Per share of common stock:
Income from continuing operations attributable
to Walmart, diluted $ 3.72 $3.35 $3.16 $2.92 $2.72
Dividends 1.09 0.95 0.88 0.67 0.60
Financial Position
Inventories $ 33,160 $ 34,511 $ 35,159 $ 33,667 $ 31,910
Property, equipment and capital lease assets, net 102,307 95,653 96,867 88,287 77,863
Total assets 170,706 163,429 163,514 151,587 138,793
Long-term debt, including obligations under capital leases 36,401 34,549 33,402 30,735 30,096
Total Walmart shareholders’ equity 70,749 65,285 64,608 61,573 53,171
Unit Counts
Walmart U.S. Segment 3,708 3,656 3,550 3,443 3,289
International Segment 4,112 3,605 3,098 2,734 2,158
Sam’s Club Segment 596 602 591 579 567
Total units 8,416 7,863 7,239 6,756 6,014
(1) In connection with the company’s finance transformation project, we reviewed and adjusted the classification of certain revenue and expense items within our Consolidated
Statements of Income for financial reporting purposes. Although the reclassifications impacted net sales, gross margin and operating, selling, general and administrative
expenses, they did not impact operating income or income from continuing operations attributable to Walmart. The changes were effective February 1, 2009 and have
been reflected for fiscal years 2010, 2009 and 2008.
(2) Comparable store and club sales include fuel. For fiscal 2006, we considered comparable sales to be sales at stores and clubs that were open as of February 1st of the prior
fiscal year and which had not been converted, expanded or relocated since that date. Fiscal 2008 and fiscal 2007 comparable sales includes all stores and clubs that have been
open for at least the previous 12 months. Additionally, for those fiscal years, stores and clubs that are relocated, expanded or converted are excluded from comparable sales
for the first 12 months following the relocation, expansion or conversion. Fiscal 2010 and 2009 comparable sales include sales from stores and clubs open for the previous
12 months, including remodels, relocations and expansions. Fiscal 2008 and prior fiscal years’ comparable sales do not reflect reclassifications effective February 1, 2009,
as noted above.
Five-Year Financial Summary
2010 FINANCIAL REVIEW
Walmart 2010 Annual Report 15