Walmart 2010 Annual Report Download - page 20
Download and view the complete annual report
Please find page 20 of the 2010 Walmart annual report below. You can navigate through the pages in the report by either clicking on the pages listed below, or by using the keyword search tool below to find specific information within the annual report.-
 1
1 -
2
-
3
-
4
-
5
-
6
-
7
-
8
-
9
-
 10
10 -
 11
11 -
 12
12 -
 13
13 -
 14
14 -
 15
15 -
 16
16 -
 17
17 -
 18
18 -
 19
19 -
 20
20 -
 21
21 -
 22
22 -
 23
23 -
 24
24 -
 25
25 -
 26
26 -
 27
27 -
 28
28 -
 29
29 -
 30
30 -
31
-
32
-
33
-
34
-
35
-
36
-
37
-
38
-
39
-
40
-
41
-
42
-
43
-
44
-
45
-
46
-
47
-
48
-
49
-
50
-
51
-
52
-
53
-
54
-
55
-
56
-
57
-
58
-
59
-
60
 |
 |

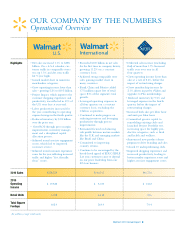
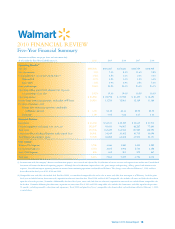
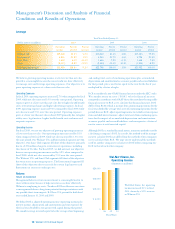
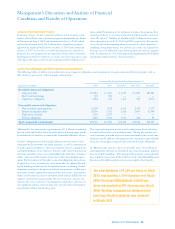
Leverage
Fiscal Years Ended January 31,
(Dollar amounts in millions) 2010 2009 2008
Operating Percent Percent Operating Percent Percent Operating Percent
income of total increase income of total increase income of total
Walmart U.S. $19,522 81.5% 5.2% $18,562 81.4% 6.8% $17,383 79.2%
International 5,033 21.0% 1.9% 4,940 21.7% 4.6% 4,725 21.5%
Sam’s Club 1,512 6.3% -8.1% 1,646 7.2% -0.1% 1,648 7.5%
Other (2,117) -8.8% -9.9% (2,350) -10.3% 30.3% (1,804) -8.2%
Total operating income $23,950 100.0% 5.1% $22,798 100.0% 3.9% $21,952 100.0%
We believe growing operating income at a faster rate than net sales
growth is a meaningful measure because it indicates how effectively
we manage costs and leverage operating expenses. Our objective is to
grow operating expenses at a slower rate than net sales.
Operating Expenses
In fiscal 2010, operating expenses increased 2.7% when compared to fiscal
2009, while net sales increased 1.0% over the same period. Operating
expenses grew at a faster rate than net sales due to higher health benefit
costs, restructuring charges and higher advertising expenses. In fiscal
2009, operating expenses increased 9.3% compared to fiscal 2008 while
net sales increased 7.3% over the same period. Operating expenses
grew at a faster rate than net sales in fiscal 2009 primarily due to higher
utility costs, legal matters, higher health benefit costs and increased
corporate expenses.
Operating Income
For fiscal 2010, we met our objective of growing operating income at
a faster rate than net sales. Our operating income increased by 5.1%
when compared to fiscal 2009, while net sales increased by 1.0% over
the same period. Our Walmart U.S. and International segments met this
objective. Our Sam’s Club segment fell short of this objective primarily
due to a $174 million charge to restructure its operations, including
the closure of 10 clubs. For fiscal 2009, we did not meet our objective
because our operating income increased by 3.9% when compared to
fiscal 2008, while net sales increased by 7.3% over the same period.
The Walmart U.S. and Sam’s Club segments fell short of this objective
due to increases in operating expenses. The International segment fell
short of this objective due to accruals for certain legal matters and
fluctuations in currency exchange rates.
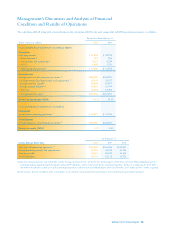
Returns
Return on Investment
Management believes return on investment is a meaningful metric to
share with investors because it helps investors assess how effectively
Walmart is employing its assets. Trends in ROI can fluctuate over time
as management balances long-term potential strategic initiatives with
any possible short-term impacts. ROI was 19.3 percent for both fiscal
years ended January 31, 2010 and 2009.
We define ROI as adjusted operating income (operating income plus
interest income, depreciation and amortization and rent expense) for
the fiscal year divided by average invested capital during that period.
We consider average invested capital to be the average of our beginning
and ending total assets of continuing operations plus accumulated
depreciation and amortization less accounts payable and accrued liabilities
for that period, plus a rent factor equal to the rent for the fiscal year
multiplied by a factor of eight.
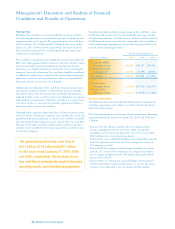
ROI is considered a non-GAAP financial measure under the SEC’s rules.
We consider return on assets (“ROA”) to be the financial measure
computed in accordance with GAAP that is the most directly comparable
financial measure to ROI as we calculate that financial measure. ROI
differs from ROA (which is income from continuing operations for the
fiscal year divided by average total assets of continuing operations for the
period) because ROI: adjusts operating income to exclude certain expense
items and adds interest income; adjusts total assets from continuing opera-
tions for the impact of accumulated depreciation and amortization,
accounts payable and accrued liabilities; and incorporates a factor of
rent to arrive at total invested capital.
Although ROI is a standard financial metric, numerous methods exist for
calculating a company’s ROI. As a result, the method used by manage-
ment to calculate ROI may differ from the methods other companies
use to calculate their ROI. We urge you to understand the methods
used by another company to calculate its ROI before comparing our
ROI to that of such other company.
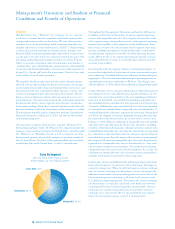
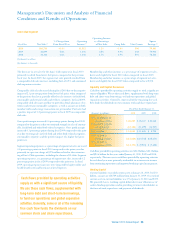
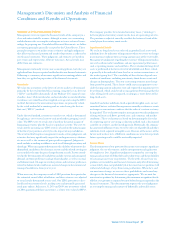
Wal-Mart Stores, Inc.
Operating Income
(Amounts in millions)
$24,000
$18,000
$12,000
$ 6,000
0
08 09 10
Wal-Mart Stores, Inc. operating
income increased 5.1% in fiscal
2010, driven by a 5.2% increase
in Walmart U.S.
Management’s Discussion and Analysis of Financial
Condition and Results of Operations
18 Walmart 2010 Annual Report
Fiscal Years