Walmart 2010 Annual Report Download - page 19
Download and view the complete annual report
Please find page 19 of the 2010 Walmart annual report below. You can navigate through the pages in the report by either clicking on the pages listed below, or by using the keyword search tool below to find specific information within the annual report.-
 1
1 -
2
-
3
-
4
-
5
-
6
-
7
-
8
-
 9
9 -
 10
10 -
 11
11 -
 12
12 -
 13
13 -
 14
14 -
 15
15 -
 16
16 -
 17
17 -
 18
18 -
 19
19 -
 20
20 -
 21
21 -
 22
22 -
 23
23 -
 24
24 -
 25
25 -
 26
26 -
 27
27 -
 28
28 -
 29
29 -
30
-
31
-
32
-
33
-
34
-
35
-
36
-
37
-
38
-
39
-
40
-
41
-
42
-
43
-
44
-
45
-
46
-
47
-
48
-
49
-
50
-
51
-
52
-
53
-
54
-
55
-
56
-
57
-
58
-
59
-
60
 |
 |

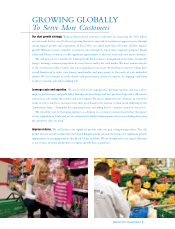
The Retail Industry
We operate in the highly competitive retail industry in both the United
States and the countries we serve internationally. We face strong sales
competition from other discount, department, drug, variety and specialty
stores, warehouse clubs, and supermarkets, many of which are national,
regional or international chains, as well as internet-based retailers and
catalog businesses. We compete with a number of companies for prime
retail site locations, as well as in attracting and retaining quality employees
(whom we call “associates”). We, along with other retail companies, are
influenced by a number of factors including, but not limited to: general
economic conditions, cost of goods, consumer disposable income, consumer
debt levels and buying patterns, consumer credit availability, interest rates,
customer preferences, unemployment, labor costs, inflation, deflation,
currency exchange fluctuations, fuel and energy prices, weather patterns,
climate change, catastrophic events, competitive pressures and insurance
costs. Further information on risks to our company can be located in
“Item 1A. Risk Factors” in our Annual Report on Form 10-K for the
fiscal year ended January 31, 2010.
Company Performance Metrics
The company’s performance metrics emphasize three priorities for
improving shareholder value: growth, leverage and returns. The
company’s priority of growth focuses on sales growth; the priority of
leverage encompasses the company’s metric to increase our operating
income at a faster rate than the growth in net sales by growing our
operating, selling, general and administrative expenses (“operating
expenses”) at a slower rate than the growth of our net sales; and the
priority of returns focuses on how efficiently the company employs
our assets through return on investment (“ROI”) and how effectively
the company manages working capital through free cash flow.
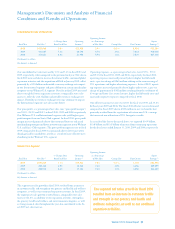
Our net sales increased by 1.0% and 7.3% in fiscal 2010 and 2009,
respectively, when compared to the previous fiscal year. Net sales in
fiscal 2010 increased due to increased customer traffic, continued global
expansion activities and the acquisition of our Chilean subsidiary,
Distribución y Servicio (“D&S”) in January 2009, offset primarily
by a $9.8 billion unfavorable currency exchange rate impact in our
International segment and price deflation in certain merchandise cate-
gories in our Walmart U.S. segment. Net sales in fiscal 2009 increased
due to our global expansion activities and comparable store sales increases,
offset by a $2.3 billion unfavorable currency exchange rate impact. Despite
the unfavorable impact of currency exchanges rates, the International
segment’s net sales as a percentage of total company net sales increased in
fiscal 2010 and 2009, respectively. Volatility in currency exchange rates
may continue to impact the International segment’s net sales in the future.
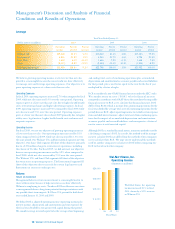
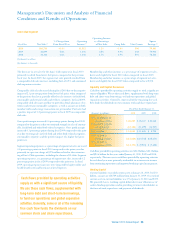
Comparable Store Sales
Fiscal Years Ended January 31,
2010 2009 2008
Walmart U.S. -0.7% 3.2% 1.0%
Sam’s Club
(1)
-1.4% 4.9% 4.9%
Total U.S. -0.8% 3.5% 1.6%
(1) Sam’s Club comparable club sales include fuel. Fuel sales had a negative impact of 2.1
percentage points in fiscal year 2010, and positive impact of 1.2 and 0.7 percentage
points in fiscal years 2009 and 2008, respectively, on comparable club sales.
Comparable store sales is a measure which indicates the performance of
our existing U.S. stores by measuring the growth in sales for such stores
for a particular period over the corresponding period in the prior year.
Comparable store sales in the United States decreased 0.8% in fiscal 2010
and increased 3.5% in fiscal 2009. Although customer traffic increased
in fiscal 2010, comparable store sales in the United States were lower
than fiscal 2009 due to deflation in certain merchandise categories and
lower fuel prices. Comparable store sales in the United States in fiscal
2009 were higher than fiscal 2008 due to an increase in customer traffic,
as well as an increase in average transaction size per customer.
As we continue to add new stores in the United States, we do so with an
understanding that additional stores may take sales away from existing
units. We estimate the negative impact on comparable store sales as a
result of opening new stores was approximately 0.6% in fiscal 2010 and
1.1% in fiscal 2009. With our planned slower new store growth, we expect
the impact of new stores on comparable store sales to stabilize over time.
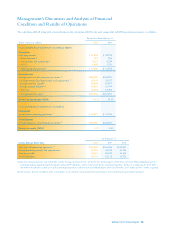
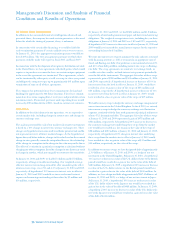
Growth
Net Sales
Fiscal Years Ended January 31,
(Dollar amounts in millions) 2010 2009 2008
Percent Percent Percent Percent Percent
Net sales of total increase Net sales of total increase Net sales of total
Walmart U.S. $258,229 63.8% 1.1% $255,348 63.7% 6.9% $238,915 63.9%
International 100,107 24.7% 1.3% 98,840 24.6% 9.1% 90,570 24.2%
Sam’s Club 46,710 11.5% -0.4% 46,899 11.7% 5.8% 44,336 11.9%
Net Sales $405,046 100.0% 1.0% $401,087 100.0% 7.3% $373,821 100.0%
Management’s Discussion and Analysis of Financial
Condition and Results of Operations
Walmart 2010 Annual Report 17