Walmart 2010 Annual Report Download - page 51
Download and view the complete annual report
Please find page 51 of the 2010 Walmart annual report below. You can navigate through the pages in the report by either clicking on the pages listed below, or by using the keyword search tool below to find specific information within the annual report.-
 1
1 -
2
-
3
-
4
-
5
-
6
-
7
-
8
-
9
-
10
-
11
-
12
-
13
-
14
-
15
-
16
-
17
-
18
-
19
-
20
-
21
-
22
-
23
-
24
-
25
-
26
-
27
-
28
-
29
-
30
-
31
-
32
-
33
-
34
-
35
-
36
-
37
-
38
-
39
-
40
-
 41
41 -
 42
42 -
 43
43 -
 44
44 -
 45
45 -
 46
46 -
 47
47 -
 48
48 -
 49
49 -
 50
50 -
 51
51 -
 52
52 -
 53
53 -
 54
54 -
 55
55 -
 56
56 -
 57
57 -
 58
58 -
 59
59 -
 60
60
 |
 |

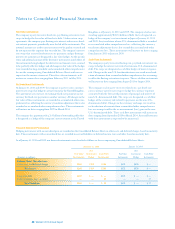
14 Segments
The company is engaged in the operations of retail stores located in all 50 states of the United States, our wholly-owned subsidiaries in Argentina,
Brazil, Canada, Japan, Puerto Rico and the United Kingdom, our majority-owned subsidiaries in Central America, Chile and Mexico and our
joint ventures in China and India and our other controlled subsidiaries in China. The company defines our segments as those business units whose
operating results our chief operating decision maker (“CODM”) regularly reviews to analyze performance and allocate resources. We sell similar
individual products and services in each of our segments. It is impractical to segregate and identify revenue and profits for each of these individual
products and services.
The Walmart U.S. segment includes the company’s mass merchant concept in the United States operating under the “Walmart” or “Wal-Mart”
brand, as well as walmart.com. The International segment consists of the company’s operations outside of the 50 United States. The Sam’s Club
segment includes the warehouse membership clubs in the United States, as well as samsclub.com. The amounts under the caption “Other” in the
table below relating to operating income are unallocated corporate overhead items.
The company measures the results of its segments using, among other measures, each segment’s operating income, which includes certain corporate
overhead allocations. From time to time, we revise the measurement of each segment’s operating income, including any corporate overhead
allocations, as dictated by the information regularly reviewed by our CODM. When we do so, the segment operating income for each segment
affected by the revisions is restated for all periods presented to maintain comparability. Information for our segments and the reconciliation to
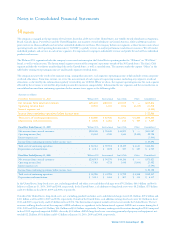
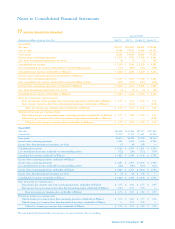
consolidated income from continuing operations before income taxes appear in the following table:
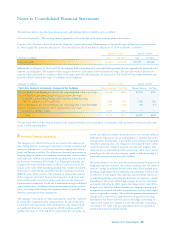
(Amounts in millions)
Fiscal Year Ended January 31, 2010 Walmart U.S. International Sam’s Club Other Consolidated
Net revenues from external customers $258,229 $100,107 $46,710 $ — $405,046
Operating income (loss) 19,522 5,033 1,512 (2,117) 23,950
Interest expense, net (1,884)
Income from continuing operations before income taxes $ 22,066
Total assets of continuing operations $ 84,480 $ 67,558 $12,073 $ 6,455 $170,566
Depreciation and amortization $ 4,206 $ 2,003 $ 541 $ 407 $ 7,157
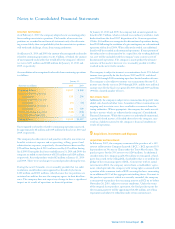
Fiscal Year Ended January 31, 2009 Walmart U.S. International Sam’s Club Other Consolidated
Net revenues from external customers $255,348 $ 98,840 $ 46,899 $ — $401,087
Operating income (loss) 18,562 4,940 1,646 (2,350) 22,798
Interest expense, net (1,900)
Income from continuing operations before income taxes $ 20,898
Total assets of continuing operations $ 84,361 $ 59,903 $ 12,339 $ 6,631 $163,234
Depreciation and amortization $ 4,013 $ 1,872 $ 527 $ 327 $ 6,739
Fiscal Year Ended January 31, 2008 Walmart U.S. International Sam’s Club Other Consolidated
Net revenues from external customers $238,915 $ 90,570 $ 44,336 $ — $373,821
Operating income (loss) 17,383 4,725 1,648 (1,804) 21,952
Interest expense, net (1,794)
Income from continuing operations before income taxes $ 20,158
Total assets of continuing operations $ 84,286 $ 61,994 $ 11,722 $ 4,545 $162,547
Depreciation and amortization $ 3,813 $ 1,684 $ 507 $ 313 $ 6,317
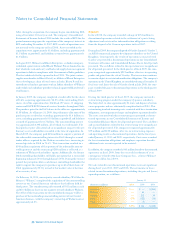
In the United States, long-lived assets, net, excluding goodwill and other assets and deferred charges were $70.2 billion, $68.0 billion and $66.8
billion as of January 31, 2010, 2009 and 2008, respectively. In the United States, cash additions to long-lived assets were $8.2 billion, $7.5 billion
and $10.4 billion in fiscal 2010, 2009 and 2008, respectively.
Outside of the United States, long-lived assets, net, excluding goodwill and other assets and deferred charges were $32.1 billion, $27.6 billion and
$30.1 billion as of fiscal 2010, 2009 and 2008, respectively. Outside of the United States, cash additions to long-lived assets were $4.0 billion in fiscal
2010 and 2009, respectively, and $4.5 billion in fiscal 2008. The International segment includes all real estate outside the United States. The net
revenues and long-lived assets of the company’s ASDA subsidiary are significant to the International segment. ASDA’s net revenues during fiscal
2010, 2009 and 2008 were $31.2 billion, $34.0 billion and $33.4 billion, respectively. Currency exchange rate fluctuations during fiscal 2010 compared
to fiscal 2009 negatively impacted ASDA’s sales in by $5.3 billion. ASDA’s long-lived assets, consisting primarily of property and equipment, net,
totaled $12.2 billion, $10.8 billion and $14.2 billion at January 31, 2010, 2009 and 2008, respectively.
Notes to Consolidated Financial Statements
Walmart 2010 Annual Report 49