Walmart 2010 Annual Report Download - page 24
Download and view the complete annual report
Please find page 24 of the 2010 Walmart annual report below. You can navigate through the pages in the report by either clicking on the pages listed below, or by using the keyword search tool below to find specific information within the annual report.-
 1
1 -
2
-
3
-
4
-
5
-
6
-
7
-
8
-
9
-
10
-
11
-
12
-
13
-
 14
14 -
 15
15 -
 16
16 -
 17
17 -
 18
18 -
 19
19 -
 20
20 -
 21
21 -
 22
22 -
 23
23 -
 24
24 -
 25
25 -
 26
26 -
 27
27 -
 28
28 -
 29
29 -
 30
30 -
 31
31 -
 32
32 -
 33
33 -
 34
34 -
35
-
36
-
37
-
38
-
39
-
40
-
41
-
42
-
43
-
44
-
45
-
46
-
47
-
48
-
49
-
50
-
51
-
52
-
53
-
54
-
55
-
56
-
57
-
58
-
59
-
60
 |
 |

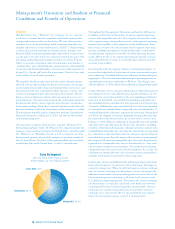
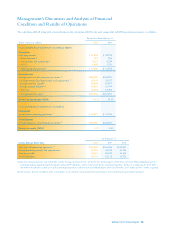
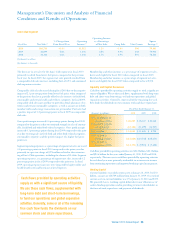
Comparable store sales were lower in fiscal 2010, despite increased
customer traffic, due to a decrease in average transaction size per customer
driven by price deflation in certain merchandise categories. Comparable
store sales were higher in fiscal 2009 due to an increase in customer traffic,
as well as an increase in average transaction size per customer.
In fiscal 2010, gross profit margin increased 0.7 percentage points
compared to the prior year due to more effective merchandising, better
inventory management and lower inventory shrinkage. In fiscal 2009, gross
profit margin increased 0.4 percentage points compared to the prior
year primarily due to decreased markdown activity and lower inven-
tory shrinkage. The improvements in both years were attributable to
merchandising initiatives that have improved space allocation, enhanced
our price leadership and increased supply chain efficiencies.
Segment operating expenses, as a percentage of segment net sales, increased
by 0.4 percentage points in fiscal 2010 compared to fiscal 2009 due to
lower segment net sales increases compared to the prior year, higher
health benefit costs, higher advertising expenses and a pre-tax charge of
$73 million relating to the restructuring of Walmart U.S. operations.
Segment operating expenses, as a percentage of segment net sales, increased
0.4 percentage points in fiscal 2009 compared to the prior year due to
hurricane-related expenses, higher bonus payments for store associates,
higher utility costs and an increase in health benefit costs.
At January 31, 2010, our International segment was comprised of our
wholly-owned subsidiaries operating in Argentina, Brazil, Canada, Japan,
Puerto Rico and the United Kingdom, our majority-owned subsidiaries
operating in five countries in Central America, and in Chile and Mexico,
our joint ventures in India and China and our other controlled subsid-
iaries in China.
The fiscal 2010 increase in the International segment’s net sales primarily
resulted from our expansion activities and the inclusion of the results
of D&S, acquired in January 2009, offset by the unfavorable impact of
changes in currency exchange rates of $9.8 billion. For additional infor-
mation regarding our acquisitions, refer to Note 9 to the Consolidated
Financial Statements. The fiscal 2009 increase in the International
segment’s net sales was primarily due to net sales growth from existing
units and our international expansion program, offset by the unfavorable
impact of changes in currency exchange rates of $2.3 billion.
In fiscal 2010, the International segment’s gross profit margin increased
0.2 percentage points compared to the prior year. The increase was pri-
marily driven by currency exchange rate fluctuations and the inclusion
of D&S. In fiscal 2009, the International segment’s gross profit margin
decreased 0.2 percentage points compared to the prior year. The decrease
was primarily driven by growth in lower margin fuel sales in the United
Kingdom and the transition to EDLP as a strategy in Japan.
Segment operating expenses, as a percentage of segment net sales, increased
0.3 percentage points in fiscal 2010 compared to the prior year primarily
as a result of the inclusion of D&S, acquired in January 2009. Segment
operating expenses, as a percentage of segment net sales, in fiscal 2009
were consistent with fiscal 2008.
In fiscal 2010, currency exchange rate changes unfavorably impacted
operating income by $540 million. In fiscal 2009, currency exchange
rate changes unfavorably impacted operating income by $266 million.
Volatility in currency exchange rates may continue to impact the
International segment’s operating results in the future.
Management’s Discussion and Analysis of Financial
Condition and Results of Operations
22 Walmart 2010 Annual Report
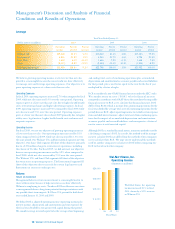
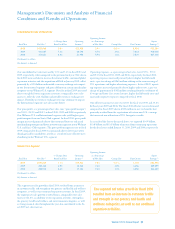
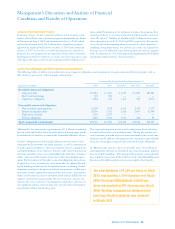
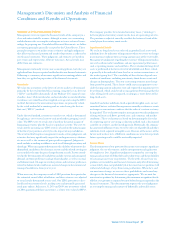
International Segment
Operating Income
% Change from Operating as a Percentage Square
Fiscal Year Net Sales
(1)
Prior Fiscal Year Income
(1)
of Net Sales Unit Counts Footage
(2
)
2010 $100,107 1.3% $5,033 5.0% 4,112 269,894
2009 98,840 9.1% 4,940 5.0% 3,605 248,803
2008 90,570 17.8% 4,725 5.2% 3,098 222,583
(1) Amounts in millions
(2) Amounts in thousands
The fiscal 2010 increase in the International
segment’s net sales primarily resulted from
our expansion activities and the inclusion of
the results of D&S, acquired in January 2009,
offset by the unfavorable impact of changes
in currency exchange rates of $9.8 billion.