Walmart 2010 Annual Report Download - page 22
Download and view the complete annual report
Please find page 22 of the 2010 Walmart annual report below. You can navigate through the pages in the report by either clicking on the pages listed below, or by using the keyword search tool below to find specific information within the annual report.-
 1
1 -
2
-
3
-
4
-
5
-
6
-
7
-
8
-
9
-
10
-
11
-
 12
12 -
 13
13 -
 14
14 -
 15
15 -
 16
16 -
 17
17 -
 18
18 -
 19
19 -
 20
20 -
 21
21 -
 22
22 -
 23
23 -
 24
24 -
 25
25 -
 26
26 -
 27
27 -
 28
28 -
 29
29 -
 30
30 -
 31
31 -
 32
32 -
33
-
34
-
35
-
36
-
37
-
38
-
39
-
40
-
41
-
42
-
43
-
44
-
45
-
46
-
47
-
48
-
49
-
50
-
51
-
52
-
53
-
54
-
55
-
56
-
57
-
58
-
59
-
60
 |
 |

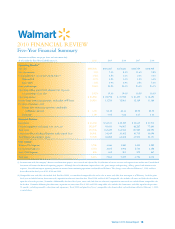
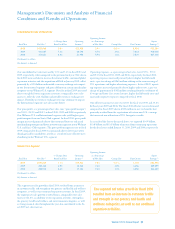
Free Cash Flow
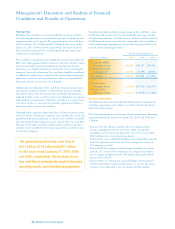
We define free cash flow as net cash provided by operating activities
of continuing operations in a period minus payments for property and
equipment made in that period. We generated positive free cash flow
of $14.1 billion, $11.6 billion and $5.7 billion for the years ended
January 31, 2010, 2009 and 2008, respectively. The increase in our
free cash flow is primarily the result of improved operating results
and inventory management.
Free cash flow is considered a non-GAAP financial measure under the
SEC’s rules. Management believes, however, that free cash flow, which
measures our ability to generate additional cash from our business
operations, is an important financial measure for use in evaluating the
company’s financial performance. Free cash flow should be considered
in addition to, rather than as a substitute for, income from continuing
operations as a measure of our performance and net cash provided by
operating activities as a measure of our liquidity.
Additionally, our definition of free cash flow is limited, in that it does
not represent residual cash flows available for discretionary expendi-
tures due to the fact that the measure does not deduct the payments
required for debt service and other contractual obligations or payments
made for business acquisitions. Therefore, we believe it is important to
view free cash flow as a measure that provides supplemental informa-
tion to our entire statement of cash flows.
Although other companies report their free cash flow, numerous meth-
ods may exist for calculating a company’s free cash flow. As a result, the
method used by our management to calculate free cash flow may differ
from the methods other companies use to calculate their free cash flow.
We urge you to understand the methods used by another company to
calculate its free cash flow before comparing our free cash flow to that
of such other company.
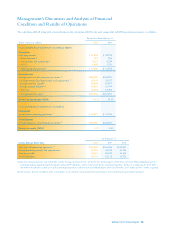
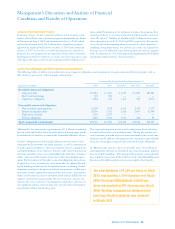
The following table sets forth a reconciliation of free cash flow, a non-
GAAP financial measure, to net cash provided by operating activities
of continuing operations, a GAAP measure, which we believe to be the
GAAP financial measure most directly comparable to free cash flow, as
well as information regarding net cash used in investing activities and
net cash used in financing activities.
Fiscal Years Ended January 31,
(Amounts in millions) 2010 2009 2008
Net cash provided by
operating activities $26,249 $ 23,147 $ 20,642
Payments for property
and equipment (12,184) (11,499) (14,937)
Free cash flow $ 14,065 $ 11,648 $ 5,705
Net cash used in
investing activities $(11,620) $(10,742) $(15,670)
Net cash used in
financing activities $(14,191) $ (9,918) $ (7,422)
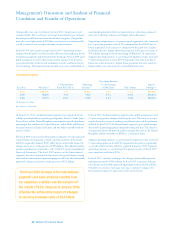
Results of Operations
The following discussion of our Results of Operations is based on our
continuing operations and excludes any results or discussion of our
discontinued operations.
Unusual or infrequent items that impacted our income from continuing
operations during the fiscal years ended 2010, 2009 and 2008 were
as follows:
• In fiscal 2010, the company announced several organizational
changes, including the closure of 10 Sam’s Clubs, designed to
strengthen and streamline our operations. As a result, we recorded
$260 million in pre-tax restructuring charges.
• In fiscal 2010, we recorded $372 million in net tax benefits primarily
from the repatriation of certain non-U.S. earnings that increased
U.S. foreign tax credits.
• In fiscal 2009, the company settled 63 wage-and-hour class action
lawsuits. As a result of the settlement, the company recorded a
pre-tax charge of approximately $382 million during the fourth
quarter of fiscal 2009.
• In fiscal 2008, we reduced our accrued liabilities for our general
liability and worker’s compensation claims. As a result, operating
expenses were reduced by a pre-tax amount of $298 million.
Management’s Discussion and Analysis of Financial
Condition and Results of Operations
20 Walmart 2010 Annual Report
We generated positive free cash flow of
$14.1 billion, $11.6 billion and $5.7 billion
for the years ended January 31, 2010, 2009
and 2008, respectively. The increase in our
free cash flow is primarily the result of improved
operating results and inventory management.