Walmart 2010 Annual Report Download - page 47
Download and view the complete annual report
Please find page 47 of the 2010 Walmart annual report below. You can navigate through the pages in the report by either clicking on the pages listed below, or by using the keyword search tool below to find specific information within the annual report.-
 1
1 -
2
-
3
-
4
-
5
-
6
-
7
-
8
-
9
-
10
-
11
-
12
-
13
-
14
-
15
-
16
-
17
-
18
-
19
-
20
-
21
-
22
-
23
-
24
-
25
-
26
-
27
-
28
-
29
-
30
-
31
-
32
-
33
-
34
-
35
-
36
-
 37
37 -
 38
38 -
 39
39 -
 40
40 -
 41
41 -
 42
42 -
 43
43 -
 44
44 -
 45
45 -
 46
46 -
 47
47 -
 48
48 -
 49
49 -
 50
50 -
 51
51 -
 52
52 -
 53
53 -
 54
54 -
 55
55 -
 56
56 -
 57
57 -
58
-
59
-
60
 |
 |

10 Share-Based Compensation Plans
As of January 31, 2010, the company has awarded share-based
compensation to executives and other associates of the company
through various share-based compensation plans. The compensation
cost recognized for all plans was $335 million, $302 million and
$276 million for fiscal 2010, 2009 and 2008, respectively, and is
included in operating, selling, general and administrative expenses
in the accompanying Consolidated Statements of Income. The total
income tax benefit recognized for all share-based compensation
plans was $126 million, $112 million and $102 million for fiscal
2010, 2009 and 2008, respectively.
The company’s Stock Incentive Plan of 2005 (the “Plan”), which is
shareholder-approved, was established to grant stock options, restricted
(non-vested) stock, performance shares and other equity compensation
awards to its associates for which 210 million shares of common stock
to be issued under the Plan have been registered under the Securities
Act of 1933, as amended. The company believes that such awards serve
to align the interests of its associates with those of its shareholders.
Under the Plan and prior plans, substantially all stock option awards
have been granted with an exercise price equal to the market price of
the company’s stock at the date of grant. Generally, outstanding options
granted before fiscal 2001 vest over seven years. Options granted after
fiscal 2001 generally vest over five years. Options granted generally have
a contractual term of 10 years.
The company’s United Kingdom subsidiary, ASDA, also offers two other
stock option plans to its colleagues. The first plan, The ASDA Colleague
Share Ownership Plan 1999 (the “CSOP”), grants options to certain
colleagues. The initial CSOP grants have both a three-year and a six-
year vesting with subsequent grants vesting over six years. The CSOP
shares have an exercise period of two months immediately following
the vesting date. The second plan, The ASDA Sharesave Plan 2000
(the “Sharesave Plan”), grants options to certain colleagues at 80% of
the average market value of the three days preceding the date of grant.
Sharesave Plan options become exercisable after three years and generally
expire six months after becoming exercisable. A combined 34 million
shares of common stock were registered under the Securities Act of 1933,
as amended, for issuance upon the exercise of stock options granted under
the CSOP and the Sharesave Plan.
Stock Options
The fair value of each stock option award is estimated on the date of
grant using the Black-Scholes-Merton option valuation model that uses
various assumptions for inputs, which are noted in the following table.
Generally, the company uses expected volatilities and risk-free interest
rates that correlate with the expected term of the option when estimat-
ing an option’s fair value. To determine the expected life of the option,
the company bases its estimates on historical exercise and expiration
activity of grants with similar vesting periods. Expected volatility is
based on historical volatility of our stock. The expected risk-free
interest rate is based on the U.S. Treasury yield curve at the time of
the grant. The expected dividend yield over the vesting period is
based on the expected dividend yield rate over the life of the grant.
The following table represents the weighted-average assumptions
used by the company to estimate the fair values of the company’s
stock options at the grant dates:
Fiscal Years Ended January 31,
2010 2009 2008
Dividend yield 2.1% 1.9% 2.1%
Volatility 18.7% 16.7% 18.6%
Risk-free interest rate 1.4% 2.0% 4.5%
Expected life in years 3.1 3.4 5.6
Notes to Consolidated Financial Statements
Walmart 2010 Annual Report 45
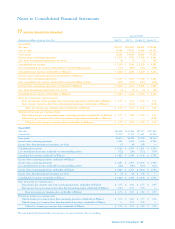
A summary of the stock option award activity for fiscal 2010 is presented below:
Weighted-Average Weighted-Average Aggregate
Stock Options Shares Exercise Price Remaining Life in Years Intrinsic Value
Outstanding at January 31, 2009 48,722,000 $49.11
Granted 1,804,000 40.16
Exercised (4,833,000) 43.94
Forfeited or expired (3,734,000) 49.44
Outstanding at January 31, 2010 41,959,000 49.32 4.8 $186,595,000
Exercisable at January 31, 2010 28,441,000 $51.35 3.8 $ 73,432,000
As of January 31, 2010, there was $94 million of total unrecognized
compensation cost related to stock options granted under the Plan, which
is expected to be recognized over a weighted-average period of 1.5 years.
The total fair value of options vested during the fiscal years ended
January 31, 2010, 2009 and 2008, was $79 million, $107 million and
$102 million, respectively.
The weighted-average grant-date fair value of options granted during
the fiscal years ended January 31, 2010, 2009 and 2008, was $10.41,
$9.97 and $11.00, respectively. Stock options granted in fiscal 2010
were primarily issued under the Sharesave Plan. The total intrinsic
value of options exercised during the years ended January 31, 2010,
2009 and 2008, was $39 million, $173 million and $60 million,
respectively. During fiscal 2010 and 2009, the company received
$111 million and $585 million, respectively, in cash from the exercise
of stock options.