Walmart 2010 Annual Report Download - page 2
Download and view the complete annual report
Please find page 2 of the 2010 Walmart annual report below. You can navigate through the pages in the report by either clicking on the pages listed below, or by using the keyword search tool below to find specific information within the annual report.-
 1
1 -
 2
2 -
 3
3 -
 4
4 -
 5
5 -
 6
6 -
 7
7 -
 8
8 -
 9
9 -
 10
10 -
 11
11 -
 12
12 -
 13
13 -
14
-
15
-
16
-
17
-
18
-
19
-
20
-
21
-
22
-
23
-
24
-
25
-
26
-
27
-
28
-
29
-
30
-
31
-
32
-
33
-
34
-
35
-
36
-
37
-
38
-
39
-
40
-
41
-
42
-
43
-
44
-
45
-
46
-
47
-
48
-
49
-
50
-
51
-
52
-
53
-
54
-
55
-
56
-
57
-
58
-
59
-
60
 |
 |

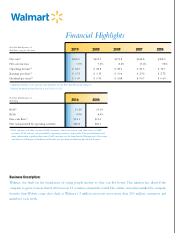
Business Description:
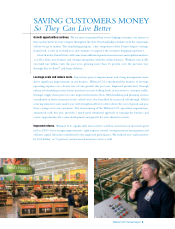
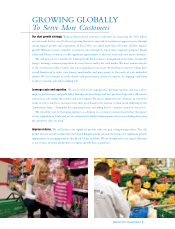
Walmart was built on the foundation of saving people money so they can live better. This mission has allowed the
company to grow to more than 8,400 stores in 15 countries around the world. The culture and values instilled by company
founder Sam Walton come alive daily, as Walmart’s 2 million associates serve more than 200 million customers and
members each week.
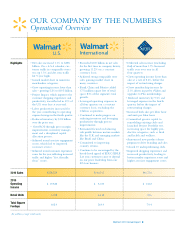
(1) Additional details can be found in the footnotes of the Five-Year Financial Summary.
(2) Annual dividend declared for fiscal year 2011 is $1.21.
2010 2009 2008 2007 2006
Net sales(1) $405.0 $401.1 $373.8 $344.8 $308.9
Net sales increase 1.0% 7.3% 8.4% 11.6% 9.8%
Operating income(1) $ 24.0 $ 22.8 $ 22.0 $ 20.5 $ 18.7
Earnings per share(1) $ 3.72 $ 3.35 $ 3.16 $ 2.92 $ 2.72
Dividend per share(2) $ 1.09 $ 0.95 $ 0.88 $ 0.67 $ 0.60
Fiscal Year Ended January 31,
(In billions, except per share data)
Financial Highlights
(1) ROI and free cash flow are non-GAAP measures, which are shown with their closest GAAP
measures, ROA and net cash provided by operating activities, respectively. The reconciliations and
other information regarding these non-GAAP measures can be found in the Management’s Discussion
and Analysis of Financial Condition and Results of Operations included in this Annual Report.
2010 2009
ROI(1) 19.3% 19.3%
ROA 8.9% 8.4%
Free cash flow(1) $14.1 $11.6
Net cash provided by operating activities $26.2 $23.1
Fiscal Year Ended January 31,
(In billions)