Walmart 2015 Annual Report Download - page 20
Download and view the complete annual report
Please find page 20 of the 2015 Walmart annual report below. You can navigate through the pages in the report by either clicking on the pages listed below, or by using the keyword search tool below to find specific information within the annual report.-
 1
1 -
2
-
3
-
4
-
5
-
6
-
7
-
8
-
9
-
 10
10 -
 11
11 -
 12
12 -
 13
13 -
 14
14 -
 15
15 -
 16
16 -
 17
17 -
 18
18 -
 19
19 -
 20
20 -
 21
21 -
 22
22 -
 23
23 -
 24
24 -
 25
25 -
 26
26 -
 27
27 -
 28
28 -
 29
29 -
 30
30 -
31
-
32
-
33
-
34
-
35
-
36
-
37
-
38
-
39
-
40
-
41
-
42
-
43
-
44
-
45
-
46
-
47
-
48
-
49
-
50
-
51
-
52
-
53
-
54
-
55
-
56
-
57
-
58
-
59
-
60
-
61
-
62
-
63
-
64
-
65
-
66
-
67
-
68
 |
 |

18 2015 Annual Report
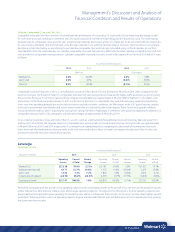
Five-Year Financial Summary
As of and for the Fiscal Years Ended January 31,
(Amounts in millions, except per share and unit count data) 2015 2014 2013 2012 2011
Operating results
Total revenues $485,651 $ 476,294 $468,651 $446,509 $421,395
Percentage change in total revenues from previous fiscal year 2.0% 1.6% 5.0% 6.0% 3.4%
Net sales 482,229 473,076 465,604 443,416 418,500
Percentage change in net sales from previous fiscal year 1.9% 1.6% 5.0% 6.0% 3.4%
Increase (decrease) in calendar comparable sales
(1)
in the United States 0.5% (0.5)% 2.4% 1.6% (0.6)%
Walmart U.S. 0.6% (0.6)% 2.0% 0.3% (1.5)%
Sam’s Club 0.0% 0.3% 4.1% 8.4% 3.9%
Gross profit margin 24.3% 24.3% 24.3% 24.5% 24.8%
Operating, selling, general and administrative expenses,
as a percentage of net sales 19.4% 19.3% 19.0% 19.2% 19.4%
Operating income $ 27,147 $ 26,872 $ 27,725 $ 26,491 $ 25,508
Income from continuing operations attributable to Walmart 16,182 15,918 16,963 15,734 15,340
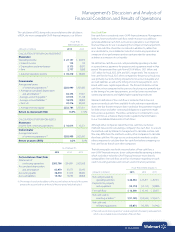
Net income per common share:
Diluted income per common share from
continuing operations attributable to Walmart $ 4.99 $ 4.85 $ 5.01 $ 4.53 $ 4.18
Dividends declared per common share 1.92 1.88 1.59 1.46 1.21
Financial position
Inventories $ 45,141 $ 44,858 $ 43,803 $ 40,714 $ 36,437
Property, equipment and capital lease assets, net 116,655 117,907 116,681 112,324 107,878
Total assets 203,706 204,751 203,105 193,406 180,782
Long-term debt and long-term capital lease obligations
(excluding amounts due within one year) 43,692 44,559 41,417 47,079 43,842
Total Walmart shareholders’ equity 81,394 76,255 76,343 71,315 68,542
Unit counts
Walmart U.S. segment 4,516 4,203 4,005 3,868 3,804
Walmart International segment 6,290 6,107 5,783 5,287 4,191
Sam’s Club segment 647 632 620 611 609
Total units 11,453 10,942 10,408 9,766 8,604
(1) Comparable sales include sales from stores and clubs open for the previous 12 months, including remodels, relocations and expansions, as well as e-commerce sales.
Comparable store and club sales include fuel.