Walmart 2015 Annual Report Download - page 65
Download and view the complete annual report
Please find page 65 of the 2015 Walmart annual report below. You can navigate through the pages in the report by either clicking on the pages listed below, or by using the keyword search tool below to find specific information within the annual report.-
 1
1 -
2
-
3
-
4
-
5
-
6
-
7
-
8
-
9
-
10
-
11
-
12
-
13
-
14
-
15
-
16
-
17
-
18
-
19
-
20
-
21
-
22
-
23
-
24
-
25
-
26
-
27
-
28
-
29
-
30
-
31
-
32
-
33
-
34
-
35
-
36
-
37
-
38
-
39
-
40
-
41
-
42
-
43
-
44
-
45
-
46
-
47
-
48
-
49
-
50
-
51
-
52
-
53
-
54
-
 55
55 -
 56
56 -
 57
57 -
 58
58 -
 59
59 -
 60
60 -
 61
61 -
 62
62 -
 63
63 -
 64
64 -
 65
65 -
 66
66 -
 67
67 -
 68
68
 |
 |

63
2015 Annual Report
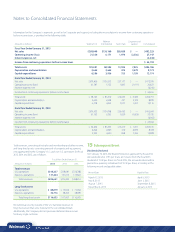
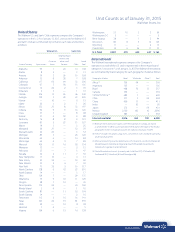
United States
The Walmart U.S. and Sam’s Club segments comprise the Company’s
operations in the U.S. As of January 31, 2015, unit counts for Walmart U.S.
and Sam’s Club are summarized by format for each state and territory
as follows:
Walmart U.S. Sam’s Club
Neighborhood
Markets and
Discount other small Grand
State or Territory Supercenters Stores formats Clubs Total
Alabama 99 1 24 14 138
Alaska 8 2 — 3 13
Arizona 79 3 26 16 124
Arkansas 75 8 38 7 128
California 117 92 64 33 306
Colorado 67 5 18 15 105
Connecticut 12 22 2 3 39
Delaware 6 3 — 1 10
Florida 216 13 65 46 340
Georgia 150 3 29 23 205
Hawaii — 10 — 2 12
Idaho 22 1 2 1 26
Illinois 133 23 8 33 197
Indiana 92 9 9 16 126
Iowa 57 3 — 8 68
Kansas 57 4 18 9 88
Kentucky 76 8 8 9 101
Louisiana 87 2 23 15 127
Maine 19 3 — 3 25
Maryland 26 21 — 12 59
Massachusetts 26 23 — 3 52
Michigan 89 5 — 26 120
Minnesota 64 6 — 14 84
Mississippi 62 4 9 7 82
Missouri 109 11 16 18 154
Montana 13 — — 2 15
Nebraska 35 — 7 5 47
Nevada 30 2 11 7 50
New Hampshire 17 10 — 4 31
New Jersey 25 34 — 10 69
New Mexico 35 2 6 7 50
New York 77 22 2 16 117
North Carolina 138 6 43 23 210
North Dakota 14 — — 3 17
Ohio 139 7 — 29 175
Oklahoma 79 9 30 11 129
Oregon 28 7 10 — 45
Pennsylvania 114 22 — 24 160
Rhode Island 5 4 — 1 10
South Carolina 81 — 11 12 104
South Dakota 14 — — 2 16
Tennessee 113 2 10 16 141
Texas 363 24 91 81 559
Utah 40 — 10 8 58
Vermont 1 4 — — 5
Virginia 104 6 12 16 138
Washington 51 10 5 3 69
Washington D.C. 2 — — — 2
West Virginia 38 — 1 5 44
Wisconsin 80 8 5 12 105
Wyoming 11 — — 2 13
Puerto Rico 12 6 26 11 55
U.S. Total 3,407 470 639 647 5,163
International
The Walmart International segment comprises the Company’s
operations outside of the U.S. and is represented in three major brand
categories. Unit counts
(1)
as of January 31, 2015 for Walmart International
are summarized by brand category for each geographic market as follows:
Geographic Market Retail Wholesale Other
(2)
Total
Africa
(3)
302 94 — 396
Argentina 105 — — 105
Brazil 468 76 13 557
Canada 394 — — 394
Central America
(4)
689 1 — 690
Chile 377 3 24 404
China 400 11 — 411
India — 20 — 20
Japan 372 — 59 431
Mexico 2,120 160 10 2,290
United Kingdom 589 — 3 592
International total 5,816 365 109 6,290
(1) Walmart International unit counts, with the exception of Canada, are stated
as of December 31, 2014, to correspond with the balance sheet date of the related
geographic market. Canada unit counts are stated as of January 31, 2015.
(2) “Other” includes restaurants, drug stores, convenience stores and banks operating
under varying banners.
(3) Africa unit counts by country are Botswana (11), Ghana (1), Lesotho (3), Malawi (2),
Mozambique (5), Namibia (4), Nigeria (6), South Africa (360), Swaziland (1),
Tanzania (1), Uganda (1) and Zambia (1).
(4) Central America unit counts by country are Costa Rica (217), El Salvador (89),
Guatemala (217), Honduras (81) and Nicaragua (86).
Unit Counts as of January 31, 2015
Wal-Mart Stores, Inc.