Walmart 2015 Annual Report Download - page 24
Download and view the complete annual report
Please find page 24 of the 2015 Walmart annual report below. You can navigate through the pages in the report by either clicking on the pages listed below, or by using the keyword search tool below to find specific information within the annual report.-
 1
1 -
2
-
3
-
4
-
5
-
6
-
7
-
8
-
9
-
10
-
11
-
12
-
13
-
 14
14 -
 15
15 -
 16
16 -
 17
17 -
 18
18 -
 19
19 -
 20
20 -
 21
21 -
 22
22 -
 23
23 -
 24
24 -
 25
25 -
 26
26 -
 27
27 -
 28
28 -
 29
29 -
 30
30 -
 31
31 -
 32
32 -
 33
33 -
 34
34 -
35
-
36
-
37
-
38
-
39
-
40
-
41
-
42
-
43
-
44
-
45
-
46
-
47
-
48
-
49
-
50
-
51
-
52
-
53
-
54
-
55
-
56
-
57
-
58
-
59
-
60
-
61
-
62
-
63
-
64
-
65
-
66
-
67
-
68
 |
 |

22 2015 Annual Report
Management’s Discussion and Analysis of
Financial Condition and Results of Operations
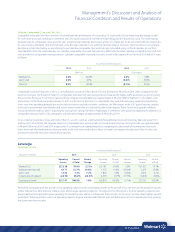
Operating Expenses
For fiscal 2015, operating expenses increased 2.3%, when compared
to the previous fiscal year, while net sales increased 1.9%, respectively,
when compared to the previous fiscal year. Accordingly, we did not
meet our objective of growing operating expenses at a slower rate than
net sales. Our continued investments in digital retail, higher health-care
expenses in the U.S. from increased enrollment and medical cost infla-
tion, the $249 million impact of wage and hour litigation in the U.S., as
well as expenses of $148 million related to the closure of approximately
30 underperforming stores in Japan were the primary factors that caused
us not to leverage for fiscal 2015. For fiscal 2014, we did not meet our
objective of growing operating expenses at a slower rate than net sales as
operating expenses as a percentage of net sales increased 27 basis points.
Overall, lower than anticipated sales, higher investment in key areas, such
as global leverage and digital retail initiatives, and the nearly $1.0 billion
of increased expenses for various matters described in the Walmart
International segment discussion, were the primary cause for the
increase in operating expenses as a percentage of net sales.
During the first quarter of fiscal 2016, the Company announced a new
associate wage structure combined with comprehensive associate
training and educational programs. We anticipate the additional
expenses in fiscal 2016 resulting from these programs will be approximately
$1.0 billion, which may impact our ability to leverage operating expenses
in fiscal 2016.
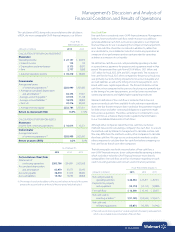
Operating Income
For fiscal 2015, we did not meet our objective of growing operating
income at the same rate or a faster rate than net sales as operating
income increased 1.0%, while net sales increased 1.9% when compared
to the previous fiscal year. This was primarily due to the factors we
discussed for not leveraging operating expenses. For fiscal 2014, we also
did not meet our objective of growing operating income at a faster rate
than net sales as operating income decreased 3.1% while net sales
increased 1.6%, when compared to the previous fiscal year. This was
primarily due to the factors we discussed for not leveraging operating
expenses, partially offset by increases in membership and other income
of 5.6%.
Returns
Return on Investment
Management believes return on investment (“ROI”) is a meaningful
metric to share with investors because it helps investors assess how
effectively Walmart is deploying its assets. Trends in ROI can fluctuate
over time as management balances long-term potential strategic
initiatives with possible short-term impacts.
ROI was 16.9% and 17.0% for the fiscal years ended January 31, 2015
and 2014, respectively. The slight change in ROI was primarily due to
continued investments in store growth and digital retail initiatives,
offset by currency exchange rate fluctuations.
We define ROI as adjusted operating income (operating income plus
interest income, depreciation and amortization, and rent expense) for
the trailing 12 months divided by average invested capital during that
period. We consider average invested capital to be the average of our
beginning and ending total assets, plus average accumulated depreciation
and average amortization, less average accounts payable and average
accrued liabilities for that period, plus a rent factor equal to the rent for
the fiscal year or trailing 12 months multiplied by a factor of eight.
When we have discontinued operations, we exclude the impact of the
discontinued operations.
Our calculation of ROI is considered a non-GAAP financial measure
because we calculate ROI using financial measures that exclude and
include amounts that are included and excluded in the most directly
comparable GAAP financial measure. For example, we exclude the
impact of depreciation and amortization from our reported operating
income in calculating the numerator of our calculation of ROI. In addition,
we include a factor of eight for rent expense that estimates the
hypothetical capitalization of our operating leases. We consider return
on assets (“ROA”) to be the financial measure computed in accordance
with generally accepted accounting principles (“GAAP”) that is the most
directly comparable financial measure to our calculation of ROI. ROI differs
from ROA (which is consolidated income from continuing operations
for the period divided by average total assets of continuing operations
for the period) because ROI: adjusts operating income to exclude certain
expense items and adds interest income; adjusts total assets of con tinuing
operations for the impact of accumulated depreciation and amortization,
accounts payable and accrued liabilities; and incorporates a factor of rent
to arrive at total invested capital.
Although ROI is a standard financial metric, numerous methods exist
for calculating a company’s ROI. As a result, the method used by
management to calculate our ROI may differ from the methods used
by other companies to calculate their ROI. We urge you to understand
the methods used by other companies to calculate their ROI before
comparing our ROI to that of such other companies.